Target 12
By 2031, reduce the rate of overrepresentation of Aboriginal and Torres Strait Islander children (0-17 years old) in out-of-home care by 45 per cent.
Dashboard snapshot: The data below are the most recent at the time of preparing the July 2023 report. Please go to the dashboard to access the current data.
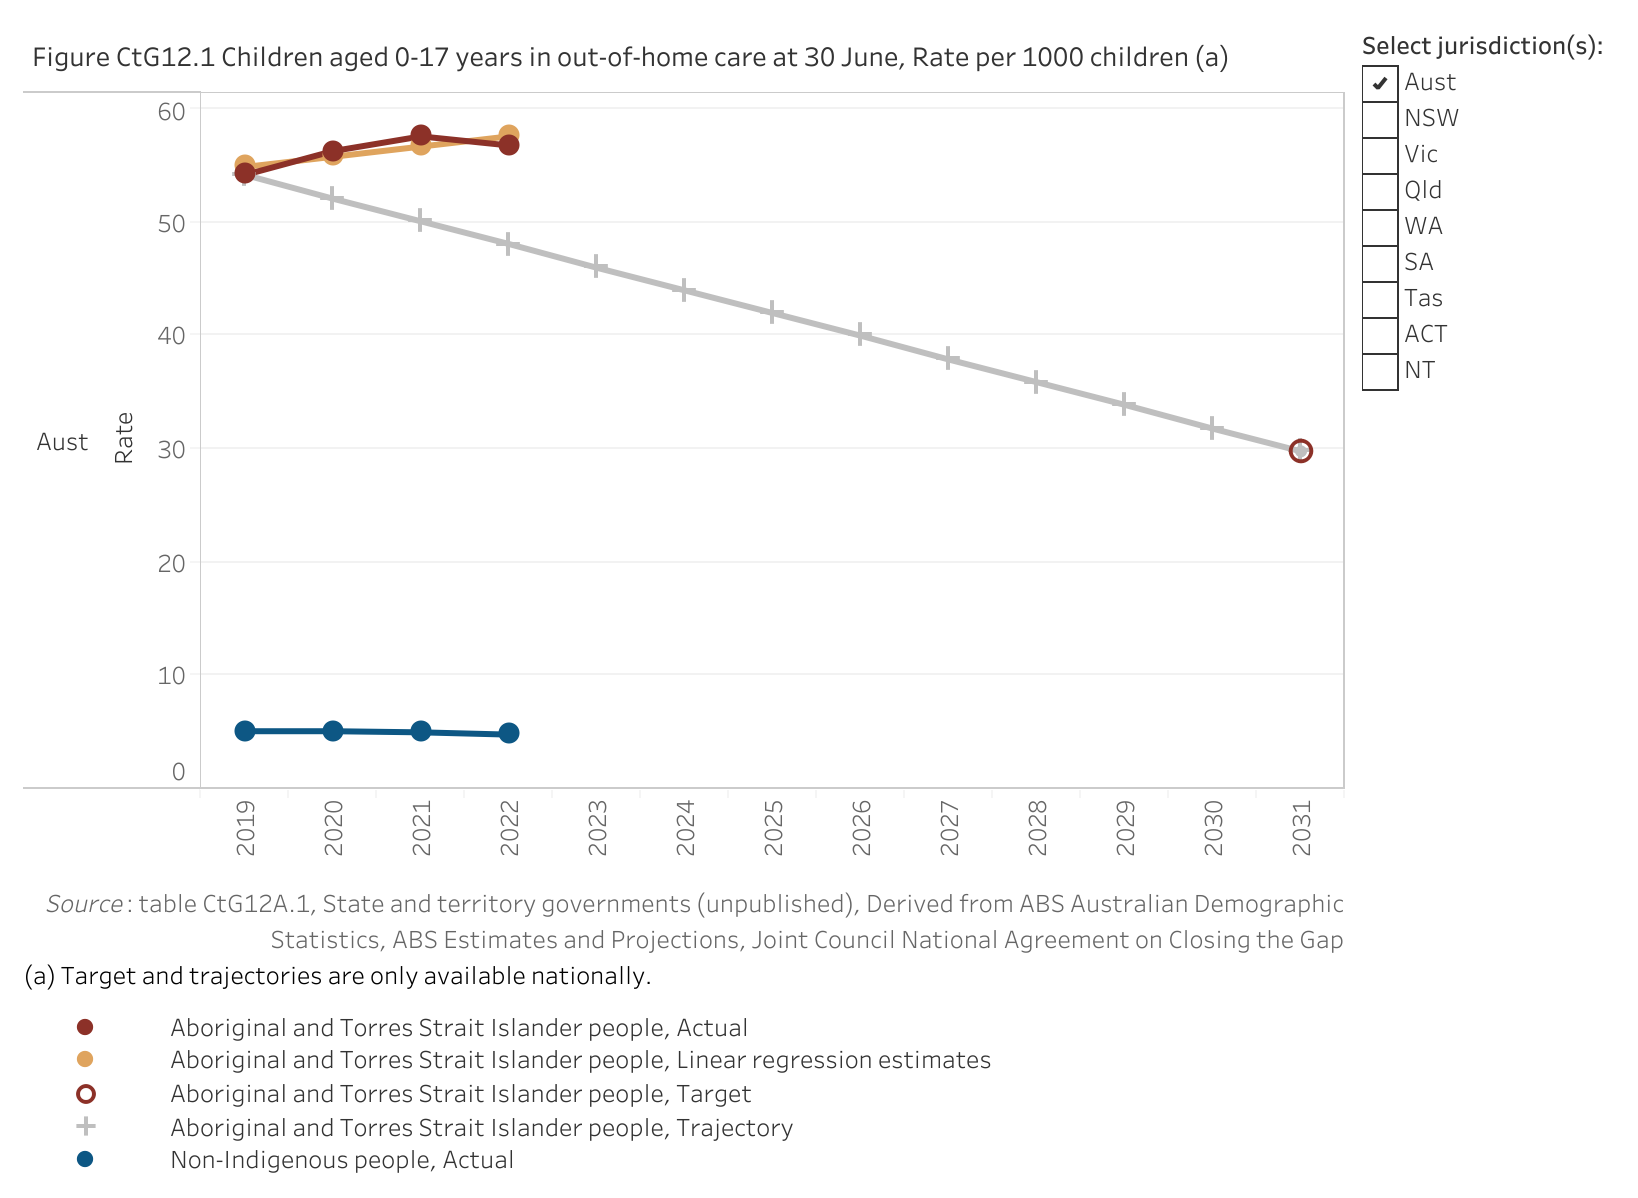
Nationally in 2022, the rate of Aboriginal and Torres Strait Islander children aged 0–17 years in out-of-home care was 56.8 per 1000 children in the population (figure CtG12.1).
The 2022 rate is below the previous year (57.6 per 1000 children in 2021) but it is an increase from 54.2 per 1000 children in 2019 (the baseline year).
Nationally, based on progress from the baseline, the target is worsening. However, this assessment should be used with caution as it is based on a limited number of data points. Please see the How to interpret the data page for more information.
The assessment below reflects progress from the baseline (improvement, worsening or no change).
| NSW | Vic | Qld | WA | SA | Tas | ACT | NT | Aust | |
|---|---|---|---|---|---|---|---|---|---|
| Assessment of progress 2019 to 2022 |  |  | | | | |  | | |
improvement no change worsening not applicable as required data not available.  good improvement and target on track to be met.
  improvement but target not on track to be met.
Note: These assessments of progress should be used with caution as they are based on a limited number of data points.
Disaggregations
By sex
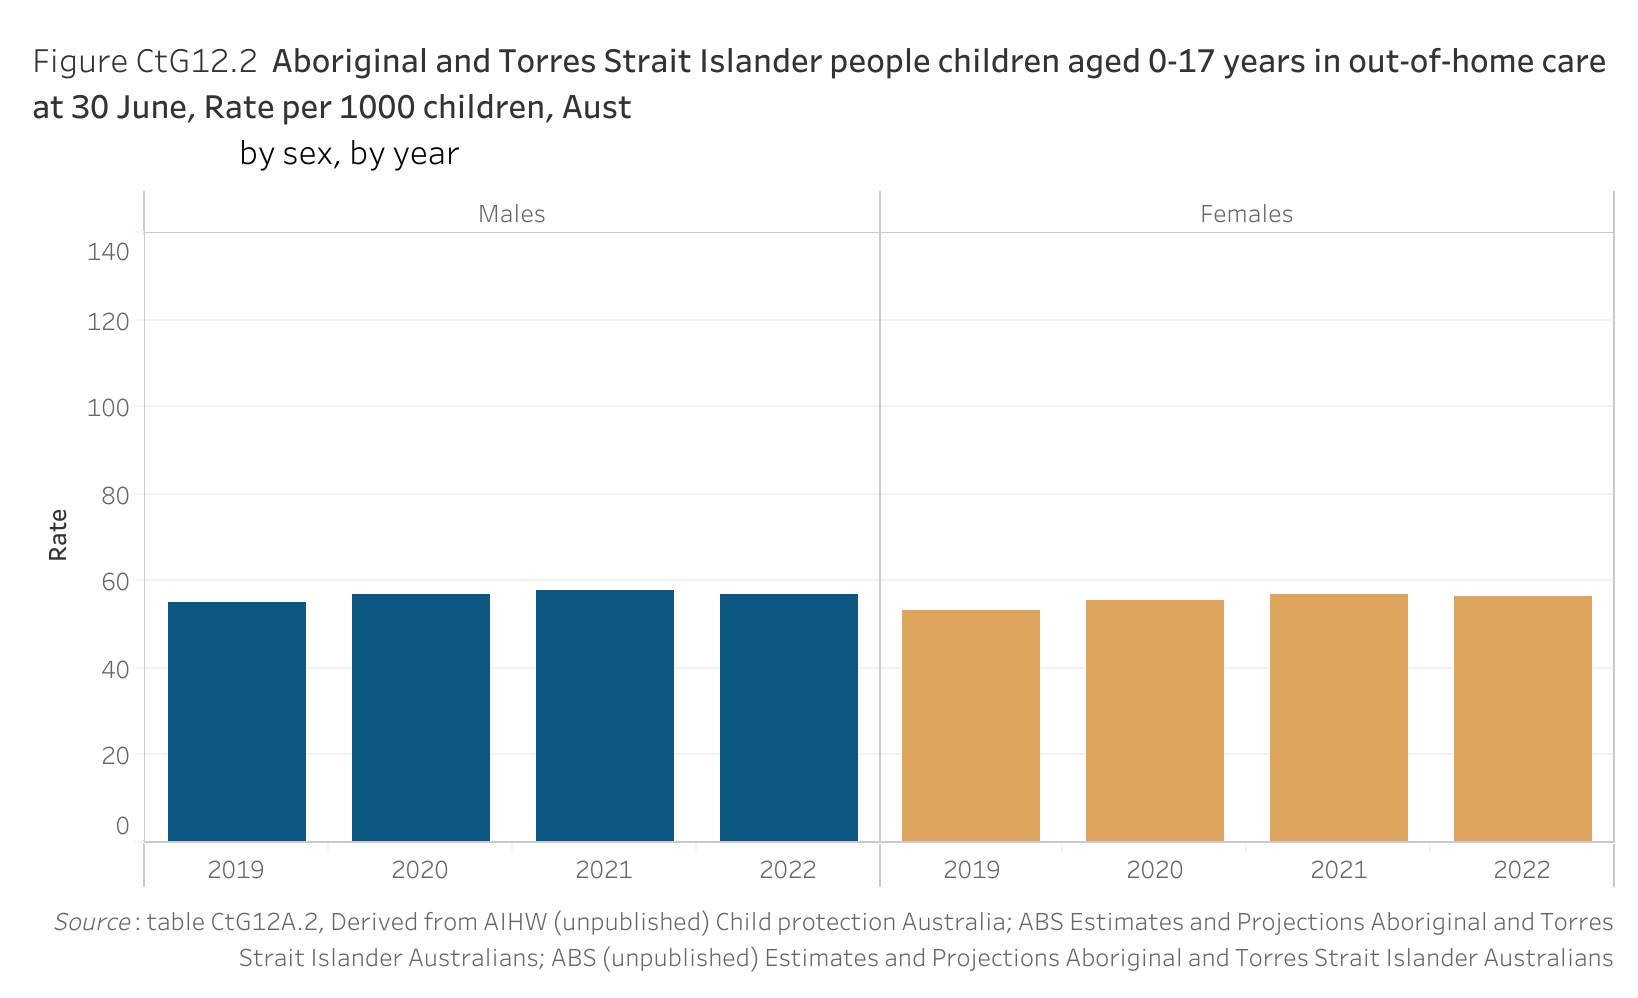
Nationally in 2022, the rate of Aboriginal and Torres Strait Islander children aged 0–17 years in out-of-home care was similar for males and females (56.9 and 56.5 per 1000 population respectively) (figure CtG12.2).
| Sex | 2019 | 2020 | 2021 | 2022 |
|---|---|---|---|---|
| Males | 55.1 | 56.9 | 58.0 | 56.9 |
| Females | 53.2 | 55.6 | 57.0 | 56.5 |
By age group
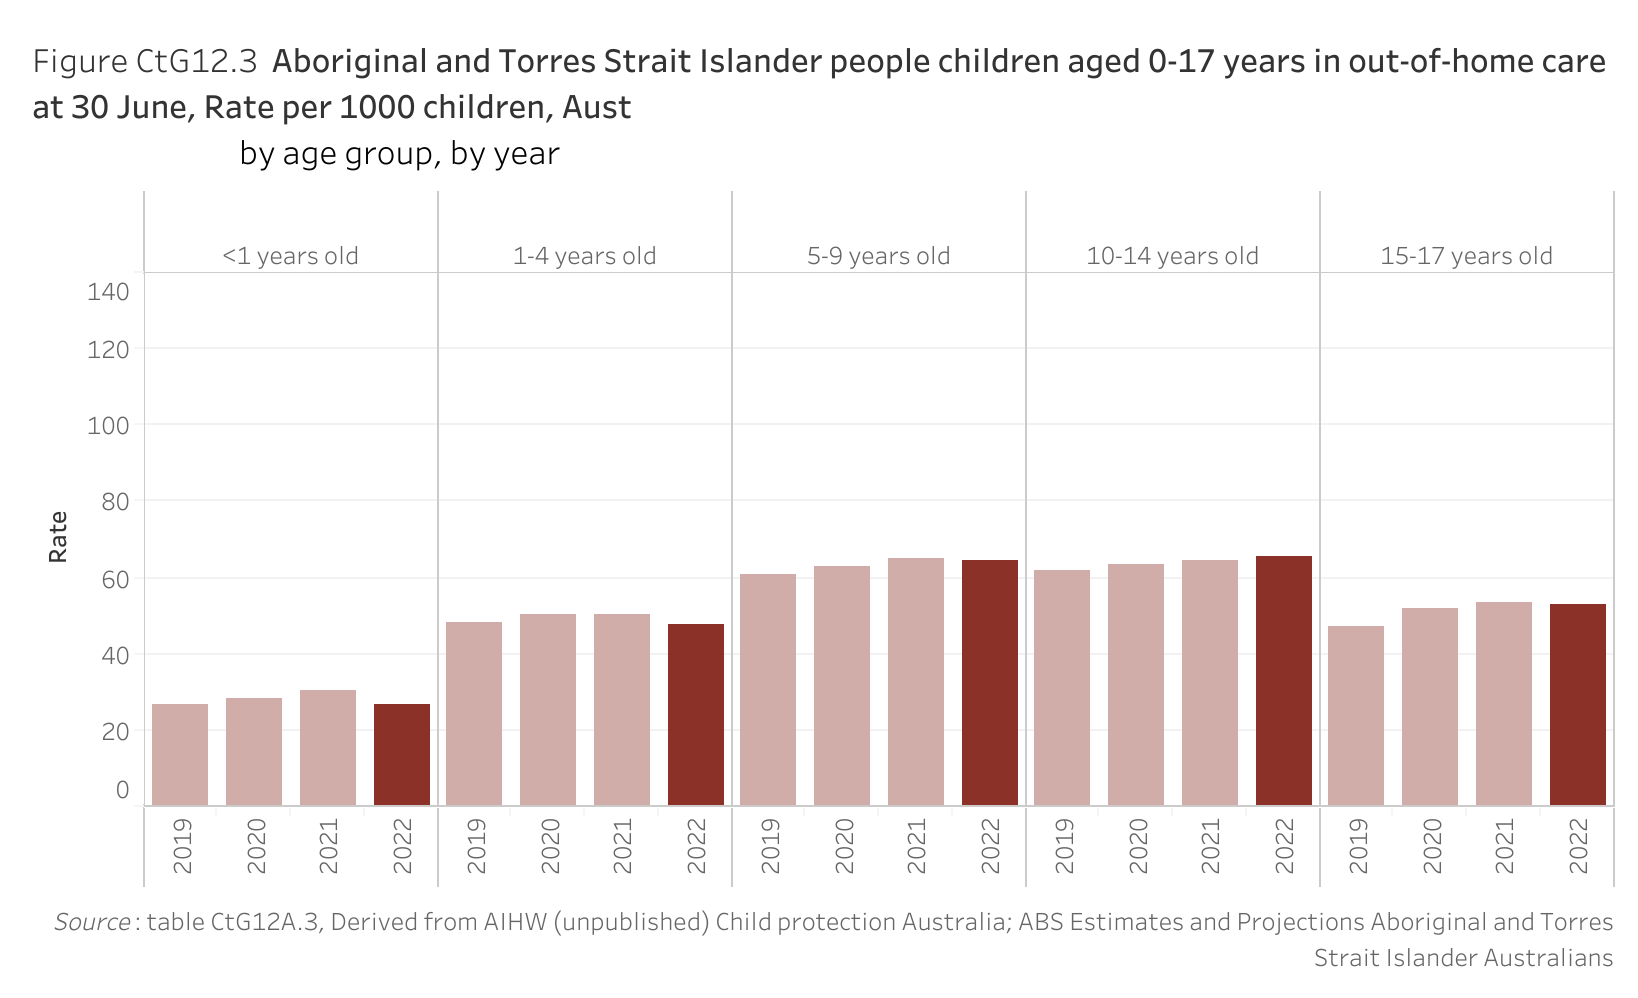
Nationally in 2022, rates for Aboriginal and Torres Strait Islander children in out-of-home care varied by age group. Aboriginal and Torres Strait Islander children aged 10-14 years and 5–9 years had the highest rates of out-of-home care (65.5 and 64.5 per 1000 children respectively), while those aged under 1 year had the lowest rate (26.5 per 1000 children) (figure CtG12.3). The national rate for children aged less than one year old decreased for the first time in the four years of reported data and is now below the rate in the 2019 baseline year.
| Age | 2019 | 2020 | 2021 | 2022 |
|---|---|---|---|---|
| <1 years old | 27.0 | 28.5 | 30.3 | 26.5 |
| 1-4 years old | 48.5 | 50.2 | 50.2 | 47.9 |
| 5-9 years old | 60.7 | 62.9 | 65.0 | 64.5 |
| 10-14 years old | 61.8 | 63.2 | 64.6 | 65.5 |
| 15-17 years old | 47.4 | 51.9 | 53.4 | 53.0 |
By disability status
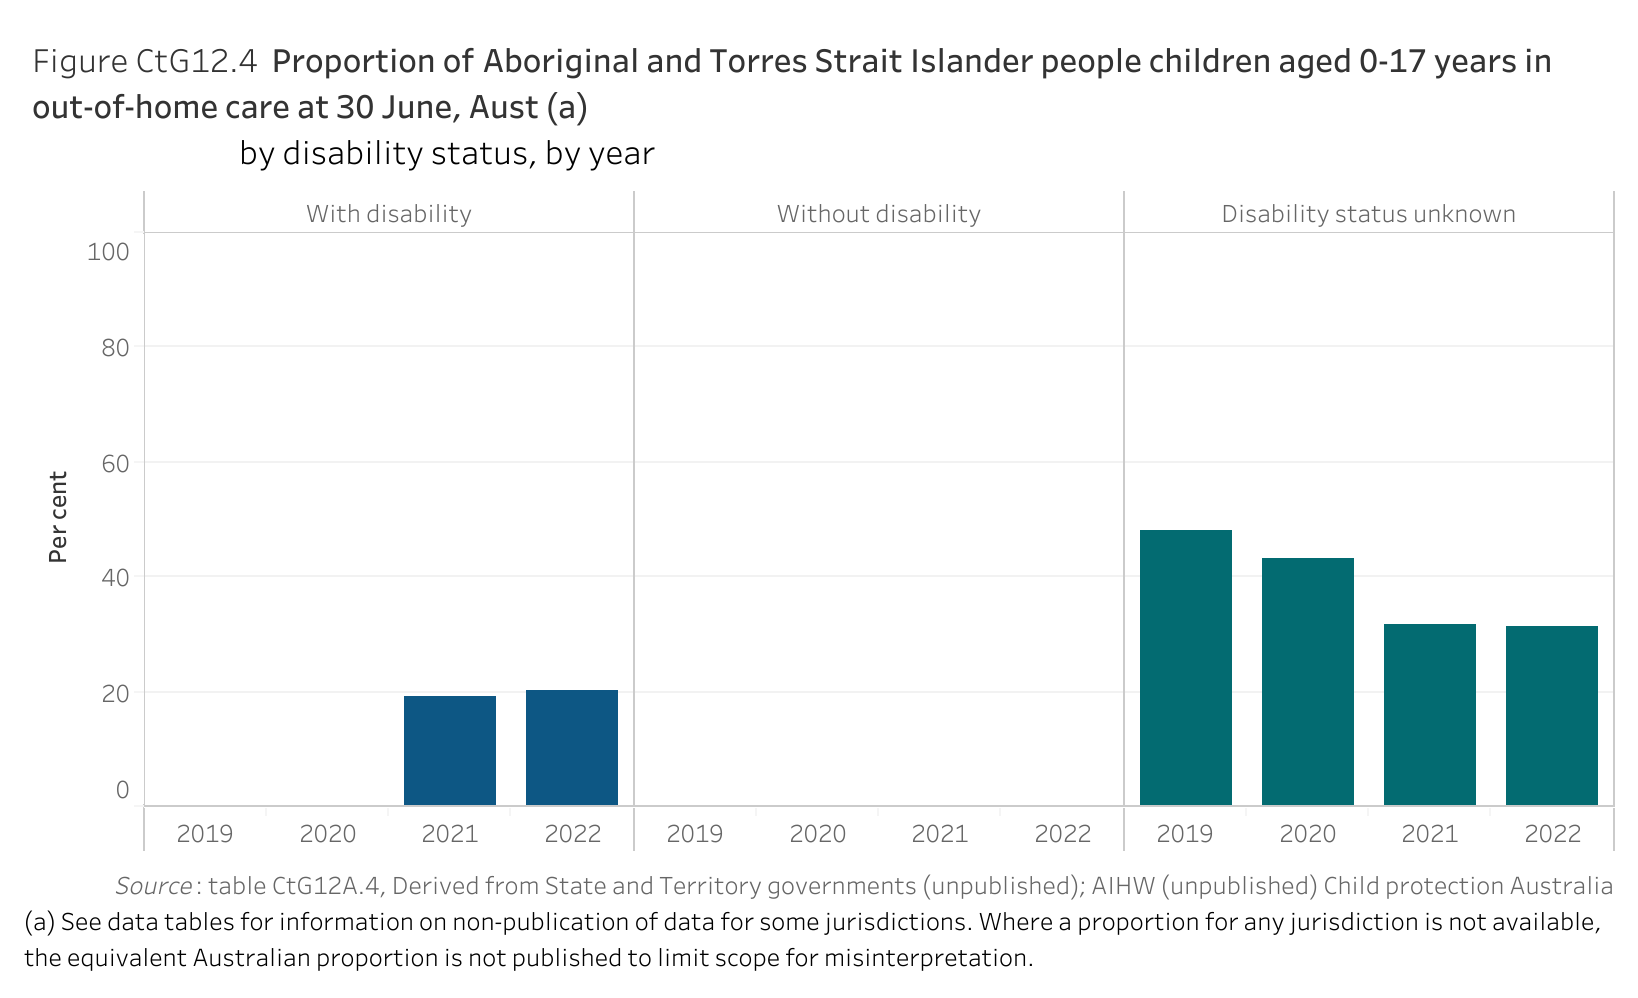
Nationally in 2022, 20.3 per cent of Aboriginal and Torres Strait Islander children in out-of-home care had a reported disability (figure CtG12.4). However, this proportion needs to be considered with caution as there is a large proportion of children (31.5 per cent) for whom disability status is unknown (figure CtG12.4).
| Description5 | 2019 | 2020 | 2021 | 2022 |
|---|---|---|---|---|
| With disability | np | np | 19.1 | 20.3 |
| Without disability | np | np | np | np |
| Disability status unknown | 48.2 | 43.3 | 31.7 | 31.5 |
np Not published.
Target data specifications
Outcome: | Aboriginal and Torres Strait Islander children are not overrepresented in the child protection system. |
|---|---|
Target: | By 2031, reduce the rate of overrepresentation of Aboriginal and Torres Strait Islander children (0-17 years old) in out-of-home care by 45 per cent. |
Indicator: | The rate of Aboriginal and Torres Strait Islander children aged 0-17 years in out-of-home care. |
Measure: | This measure is defined as: Numerator — number of Aboriginal and Torres Strait Islander children aged 0-17 years in out-of-home care, at 30 June Denominator — number of Aboriginal and Torres Strait Islander children aged 0-17 years in the population, at 30 June and is presented as a rate per 1000 children. |
Target established: | National Agreement on Closing the Gap July 2020 |
Latest dashboard update: | 15 June 2023 |
Indicator type: | Target |
Interpretation of change: | A low or decreasing rate is desirable. |
Data source(s): | Name (numerator all and denominator for data by disability status): Child Protection National Minimum Data Set (CP NMDS) Frequency: Annual Name (denominator): Estimates and Projections for Aboriginal and Torres Strait Islander population Frequency: Annual (revised data for 2019 and 2020 in the March 2022 Dashboard update) Documentation (links): https://www.aihw.gov.au/reports-data/health-welfare-services/child-protection/overview |
Data provider: | Provider name (numerator): Australian Institute of Health and Welfare Provider area: Child protection Provider name (denominator): Australian Bureau of Statistics Provider area: Demography |
Baseline year: | 2019 |
Latest reporting period: | 2022 |
Target year: | 2031 |
Disaggregations: | State and territory and Australia, by Indigenous status State and territory and Australia, by Indigenous status, by sex State and territory and Australia, by Indigenous status, by age State and territory and Australia, by Indigenous status, by disability status. |
Computation: | Numerator divided by Denominator multiplied by 1000 Counting rules Includes (numerator):
Excludes (numerator):
Denominator (excluding disability status):
Numerator (disability status):
Denominator (disability status):
Disaggregations:
Supporting calculations
|
Data quality considerations: | 2019 (to 30 June) was the first year that a single nationally consistent definition of out-of-home care has been applied across all states and territories. Prior to this, reporting of out-of-home care was not nationally consistent, and therefore historical data are not provided for this target. Data by Indigenous status are influenced by the quality of Aboriginal and Torres Strait Islander identification of young people in the CP NMDS (not stated categories are reported separately in the data table). From 2022, the ACT and the NT have adopted a policy of suppressing numbers below five and AIHW has applied additional suppression. Disaggregations:
|
Future reporting: | Additional disaggregations required for future reporting:
|
Supporting indicators
Driver
- Number of Aboriginal and Torres Strait Islander children in out-of-home care
- Proportion of children in out-of-home care (0-17 years old) that are Aboriginal and Torres Strait Islander
- Proportion of children on care and protection order that are Aboriginal and Torres Strait Islander
Contextual information
- Proportion of children (0-17 years old) who spent time in out-of-home care by length of time categories that are Aboriginal and Torres Strait Islander
e.g. 12 months, 24 months etc.
- Measuring progress of the application of the Aboriginal and Torres Strait Islander Child Placement Principle (ATSICPP): Proportion of Aboriginal and Torres Strait Islander children in out-of-home care
By type of placement; by relationship with caregiver
- Proportion of children aged 0-17 in out-of-home care that are Aboriginal and Torres Strait Islander who were placed with relatives or kin, or other Aboriginal and Torres Strait Islander carers
- Proportion of children aged 0-17 in out-of-home care that are Aboriginal and Torres Strait Islander who have current documented and approved cultural support plans
- Proportion of children admitted to out-of-home care that are Aboriginal and Torres Strait Islander
- Proportion of children who exited out-of-home-care to a permanency outcome that are Aboriginal and Torres Strait Islander
- Proportion of children 0-17 discharged from out-of-home care that are Aboriginal and Torres Strait Islander
- Proportion of children that are Aboriginal and Torres Strait Islander aged 0-16 who exited out-of-home care to reunification in the previous year and did not return to out-of-home care in 12 months or less
- Proportion of children who were subjects of substantiations of notifications that are Aboriginal and Torres Strait Islander
- Rates of substantiation of a notification by type of abuse
Including emotional abuse, neglect, physical abuse and sexual abuse
- Proportion of children who were the subject of a substantiation of a notification that are Aboriginal and Torres Strait Islander by type of abuse
Including emotional abuse, neglect, physical abuse and sexual abuse
Material for download
- Children are not overrepresented in the child protection system data tables (XLSX - 77 Kb)
- Children are not overrepresented in the child protection system dataset (CSV - 163 Kb)
To assist with interpretation of the data provided (Excel data tables and CSV dataset) please refer to the target data specification above.