Driver
Proportion of children in out-of-home care (0-17 years old) that are Aboriginal and Torres Strait Islander
Dashboard snapshot: The data below are the most recent at the time of preparing the July 2023 report. Please go to the dashboard to access the current data.
Measure
Proportion of children aged 0-17 years in out-of-home care who are Aboriginal or Torres Strait Islander
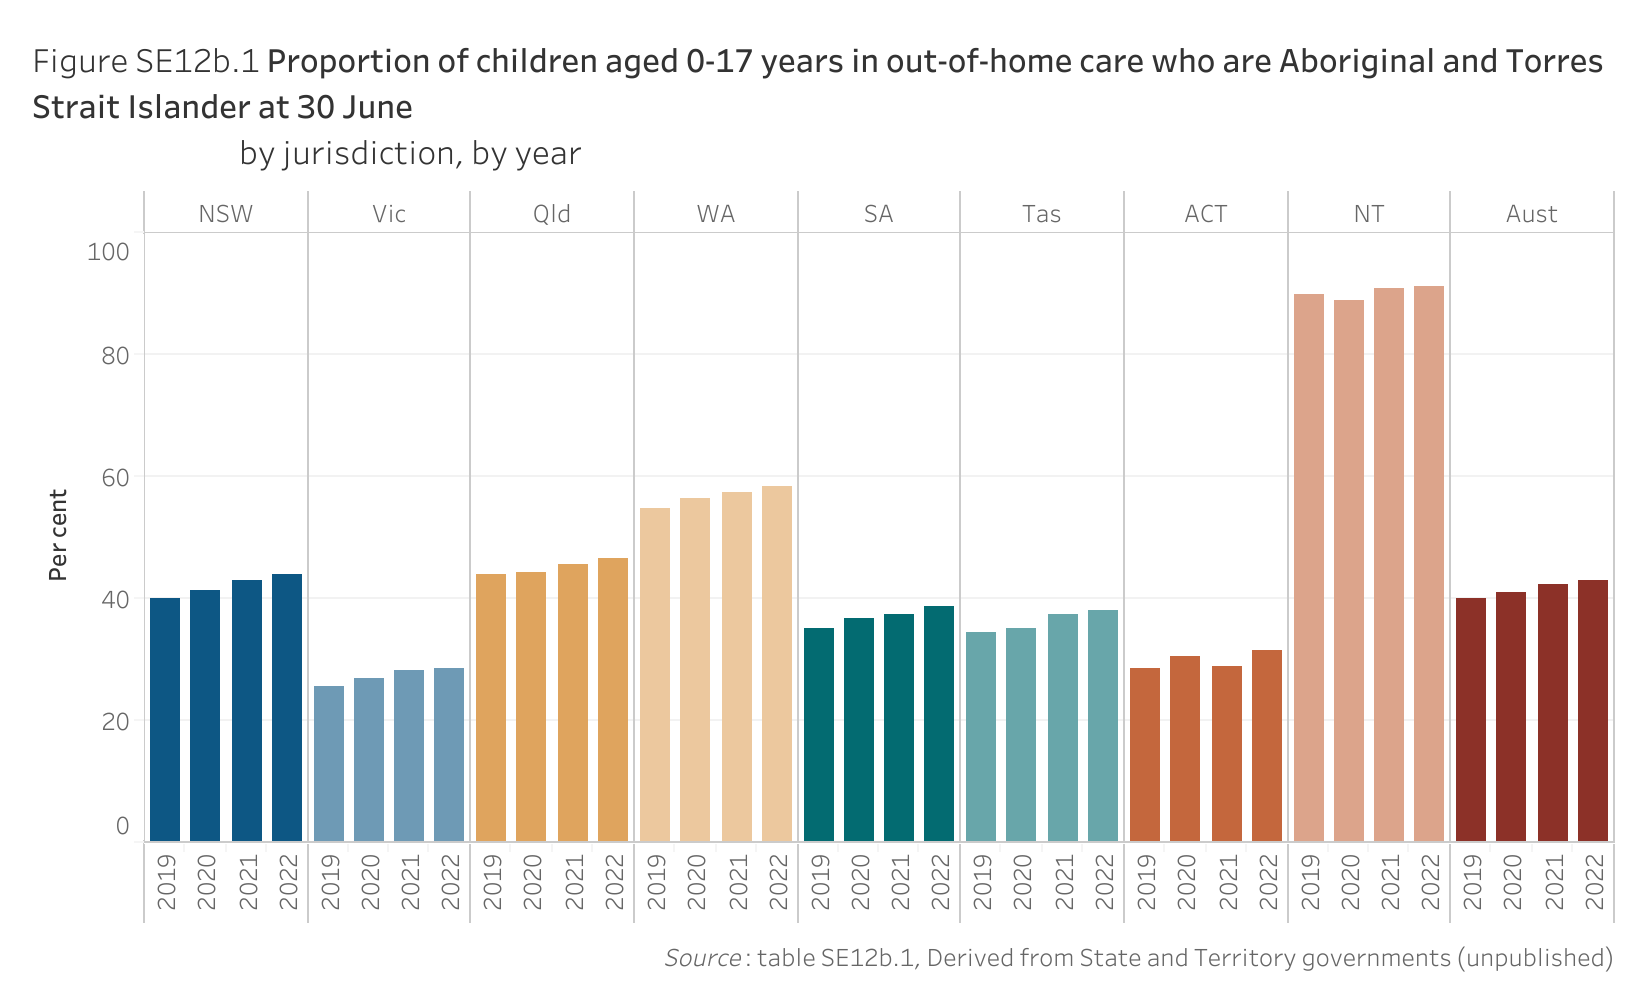
Nationally in 2022, 42.8 per cent of children aged 0-17 years old in out-of-home care were Aboriginal and Torres Strait Islander – an increase of 2.8 percentage points since 2019 (figure SE12b.1). In comparison, the proportion of children aged 0-17 years old in the general population in 2022 who were Aboriginal and Torres Strait Islander was 6.0 per cent (table SE12b.1).
| Year | NSW | Vic | Qld | WA | SA | Tas | ACT | NT | Aust |
|---|---|---|---|---|---|---|---|---|---|
| 2019 | 40.0 | 25.7 | 44.0 | 54.8 | 35.2 | 34.3 | 28.6 | 89.8 | 40.0 |
| 2020 | 41.4 | 26.9 | 44.3 | 56.5 | 36.7 | 35.0 | 30.5 | 88.8 | 41.0 |
| 2021 | 43.0 | 28.1 | 45.5 | 57.5 | 37.5 | 37.4 | 29.0 | 90.7 | 42.2 |
| 2022 | 43.8 | 28.4 | 46.7 | 58.4 | 38.6 | 38.0 | 31.4 | 91.1 | 42.8 |
Indicator data specifications
Related outcome: | Aboriginal and Torres Strait Islander children are not overrepresented in the child protection system. |
|---|---|
Related target: | By 2031, reduce the rate of overrepresentation of Aboriginal and Torres Strait Islander children (0-17 years old) in out-of-home care by 45 per cent |
Indicator: | Proportion of children in out-of-home care (0-17 years old) that are Aboriginal and Torres Strait Islander |
Measure: | This measure is defined as: Numerator — number of Aboriginal and Torres Strait Islander children aged 0-17 years in out-of-home care, at 30 June Denominator — number of all children aged 0-17 years in out-of-home care, at 30 June and is presented as a percentage. Supporting data are reported on the proportion of children in the community that are Aboriginal and Torres Strait Islander. |
Indicator established: | National Agreement on Closing the Gap July 2020 |
Latest dashboard update for the indicator: | 15 June 2023 |
Indicator type: | Driver |
Interpretation of change: | A proportion in out-of-home care similar or below the proportion in the community is desirable |
Data source(s): | Name: Child Protection National Minimum Data Set (CP NMDS) Frequency: Annual Documentation (links): https://www.aihw.gov.au/reports-data/health-welfare-services/child-protection/overview |
Data provider: | Provider name: Australian Institute of Health and Welfare Provider area: Child protection |
Baseline year: | 2019 |
Latest reporting period: | 2022 |
Disaggregations: | State and territory and Australia |
Computation: | Numerator divided by Denominator multiplied by 100 Counting rules Includes (numerator and denominator):
Includes (denominator): Children for whom Indigenous status was not stated. |
Data quality considerations: | Data by Indigenous status are influenced by the quality of Aboriginal and Torres Strait Islander identification of young people in the CP NMDS (not stated categories are reported separately in the data table). |
Future reporting: | Additional disaggregations required for future reporting:
|