Target 3
By 2025, increase the proportion of Aboriginal and Torres Strait Islander children enrolled in Year Before Full time Schooling (YBFS) early childhood education to 95 per cent.
Dashboard snapshot: The data below are the most recent at the time of preparing the July 2023 report. Please go to the dashboard to access the current data.
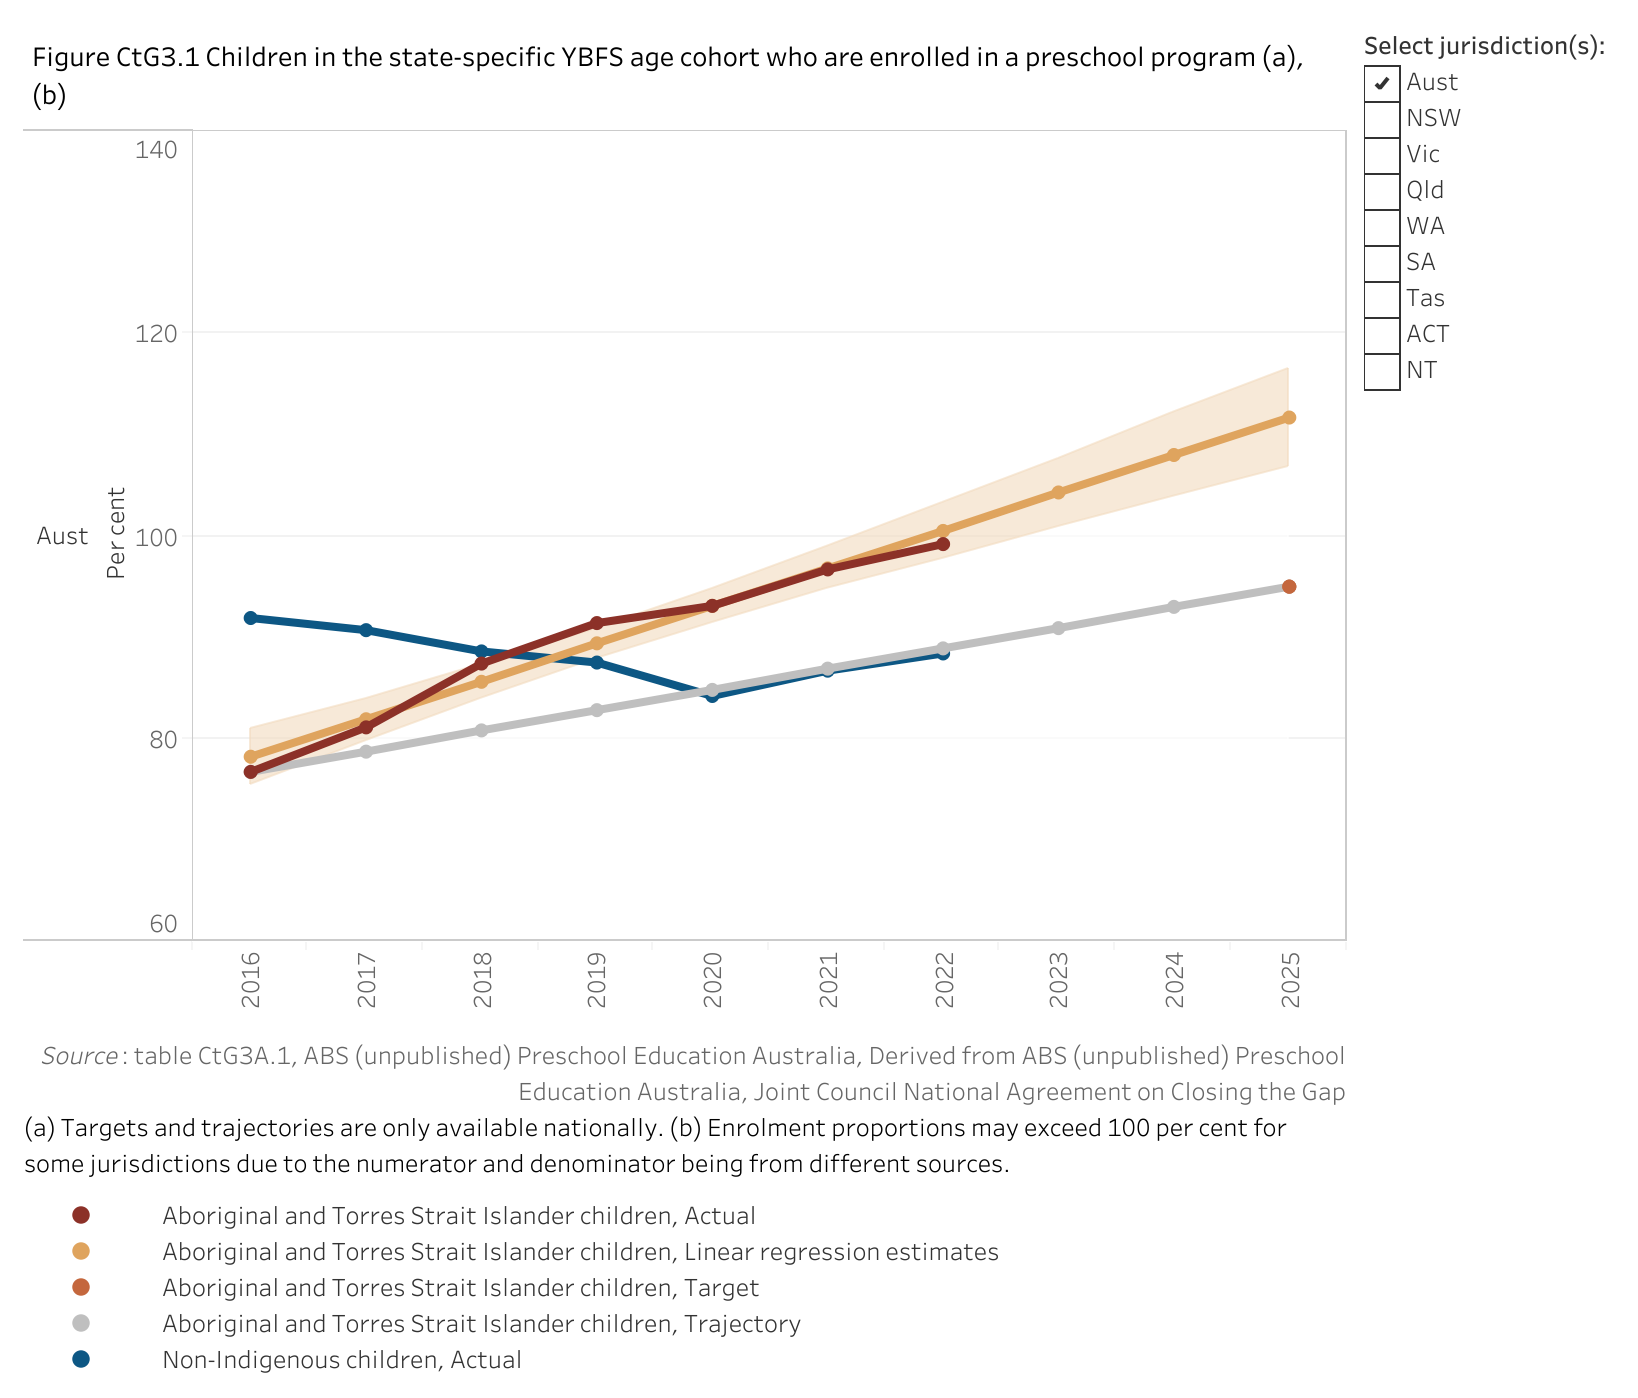
Nationally in 2022, 99.2 per cent of Aboriginal and Torres Strait Islander children in the Year Before Full time Schooling (YBFS) age cohort were enrolled in a preschool program (figure CtG3.1).
This is an increase from 76.7 per cent in 2016 (the baseline year).
Nationally, based on progress from the baseline, the target shows good improvement and is on track to be met. This assessment is provided with a high level of confidence. Please see the How to interpret the data page for more information.
The assessment below reflects progress from the baseline (improvement, worsening or no change). For the national assessment, the target outcome shows good improvement and is on track to be met.
| NSW | Vic | Qld | WA | SA | Tas | ACT | NT | Aust | |
|---|---|---|---|---|---|---|---|---|---|
| Assessment of progress 2016 to 2022 |  | | | | | | |  |  |
| Confidence level | High | High | High | High | High | High | High | Low | High |
improvement  no change worsening not applicable as required data not available. good improvement and target on track to be met.
  improvement but target not on track to be met.
Note: These assessments of progress are provided with a 'High' or 'Low' level of confidence. An assessment reported with a High level of confidence is considered to be more reliable than one reported with a Low level of confidence. Please see the 'How to interpret the data' page for more information.
Disaggregations
By sex
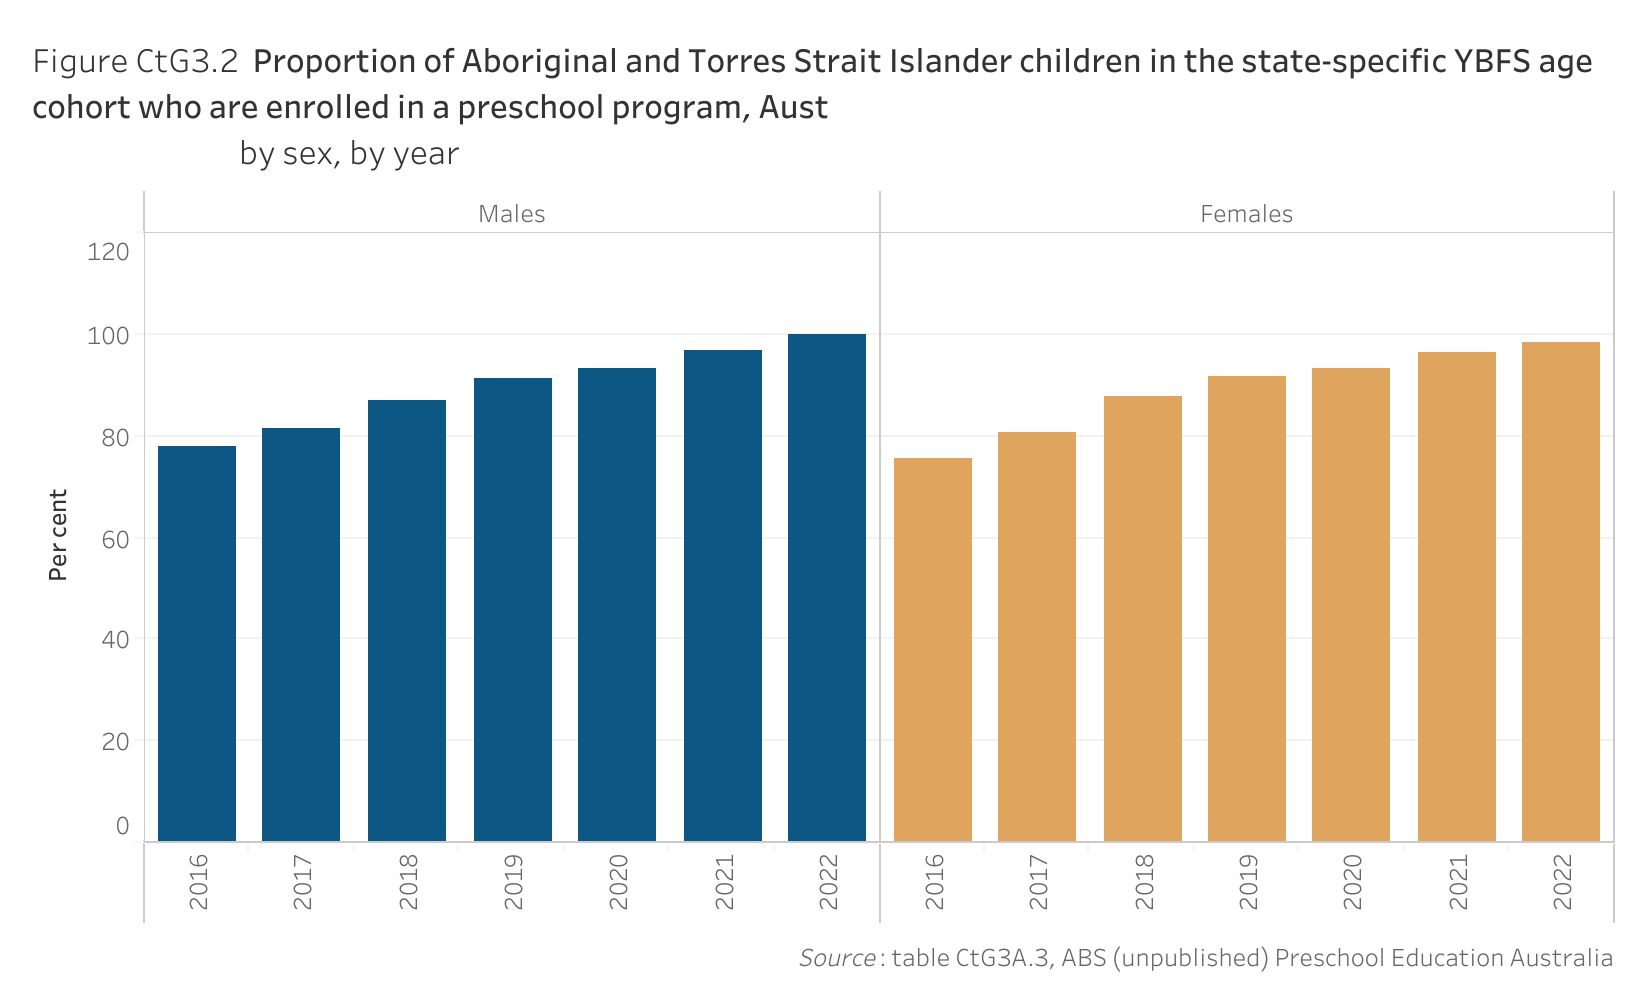
Nationally in 2022, a similar proportion of Aboriginal and Torres Strait Islander boys in the state-specific YBFS age cohort (99.8 per cent) compared to girls (98.4 per cent) were enrolled in a preschool program (figure CtG3.2). The proportions have increased at a similar rate for boys and girls since the 2016 baseline year.
| Sex | 2016 | 2017 | 2018 | 2019 | 2020 | 2021 | 2022 |
|---|---|---|---|---|---|---|---|
| Males | 77.8 | 81.6 | 87.1 | 91.3 | 93.1 | 96.8 | 99.8 |
| Females | 75.5 | 80.5 | 87.8 | 91.5 | 93.2 | 96.5 | 98.4 |
By remoteness area
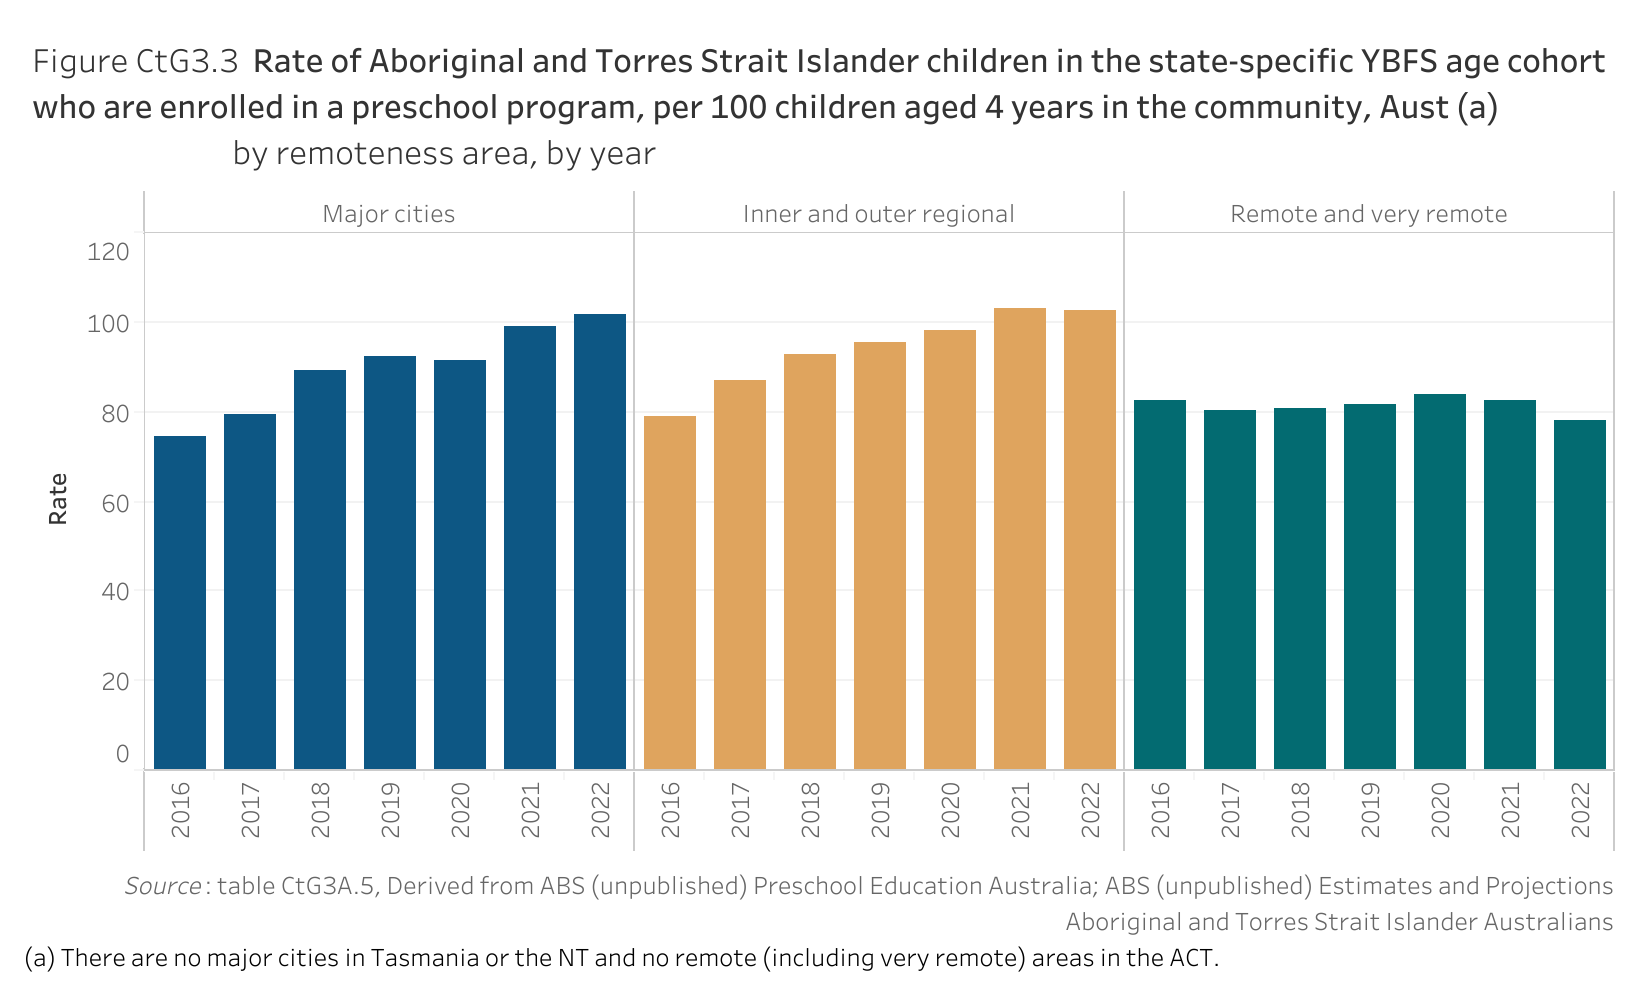
Nationally in 2022, the rates of Aboriginal and Torres Strait Islander children aged in the state-specific YBFS age cohort who were enrolled in a preschool program, per 100 children aged four years in the community, were highest in inner and outer regional areas and major cities, following increases from the 2016 baseline year (figure CtG3.3). In contrast, the rate was lower for remote and very remote areas, and with a decrease from the 2016 baseline year.
(State and territory rates, by remoteness area, are only available for 2016.)
| Remoteness | 2016 | 2017 | 2018 | 2019 | 2020 | 2021 | 2022 |
|---|---|---|---|---|---|---|---|
| Major cities | 74.3 | 79.3 | 89.0 | 92.3 | 91.4 | 99.2 | 101.6 |
| Inner and outer regional | 79.0 | 86.9 | 92.8 | 95.3 | 98.1 | 103.2 | 102.4 |
| Remote and very remote | 82.5 | 80.5 | 80.6 | 81.7 | 84.0 | 82.4 | 78.1 |
By Index of Relative Socioeconomic Disadvantage (IRSD) quintile
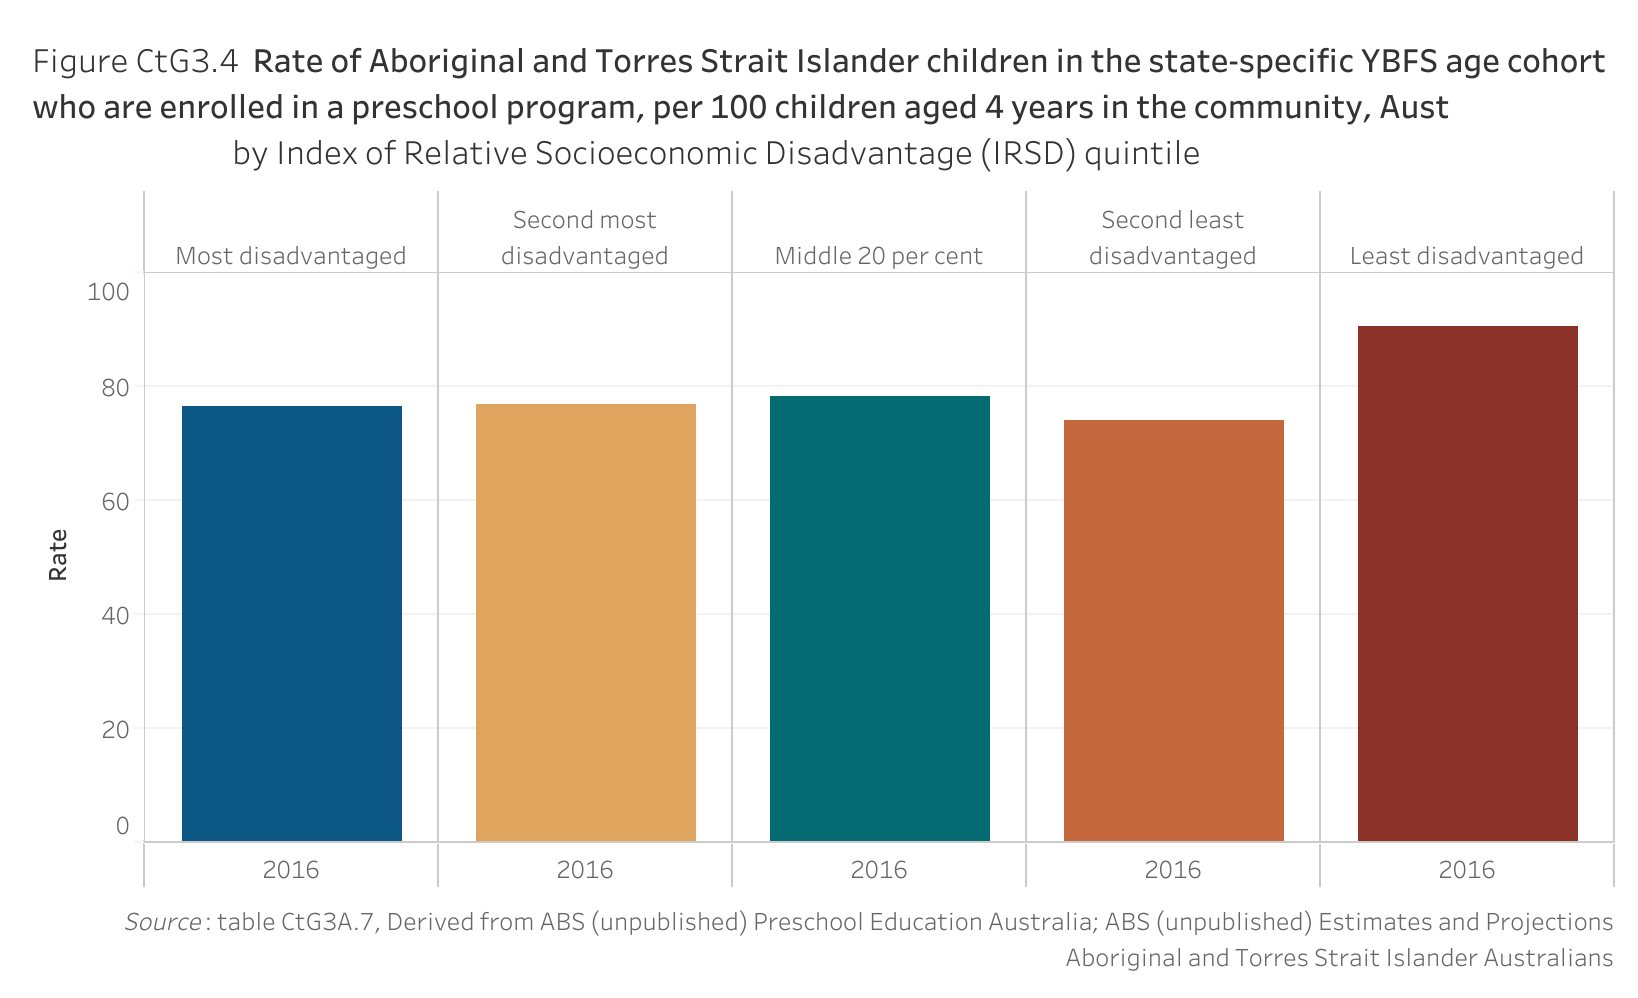
Nationally in 2016, the rate of Aboriginal and Torres Strait Islander children aged in the state-specific YBFS age cohort who were enrolled in a preschool program, per 100 children aged four years in the community, was highest (90.7 per 100 children) in the least disadvantaged socioeconomic areas of Australia (figure CtG3.4). Children living in the other areas of Australia were enrolled in a preschool program at similar rates across the IRSD quintiles (between 74.1 and 78.3 enrolments per 100 children).
(National rates, by IRSD, are available for 2016 only.)
| Description5 | 2016 |
|---|---|
| Most disadvantaged | 76.4 |
| Second most disadvantaged | 76.7 |
| Middle 20 per cent | 78.3 |
| Second least disadvantaged | 74.1 |
| Least disadvantaged | 90.7 |
By disability status
In 2022, the rates of disability were higher for Aboriginal and Torres Strait Islander children enrolled in a State and Territory government-funded preschool program in the YBFS, than for non-Indigenous children, across the states and territories for which data were available (table CtG3A.9).
Target data specifications
Outcome: | Aboriginal and Torres Strait Islander children are engaged in high quality, culturally appropriate early childhood education in their early years. |
|---|---|
Target: | By 2025, increase the proportion of Aboriginal and Torres Strait Islander children enrolled in Year Before Full time Schooling (YBFS) early childhood education to 95 per cent. |
Indicator: | The proportion of Aboriginal and Torres Strait Islander children in the state-specific YBFS age cohort who are enrolled in a preschool program. |
Measure: | This measure is defined as: Numerator — the estimated number of children in the state-specific YBFS age cohort enrolled in a preschool program Denominator — the estimated number of children in the state-specific YBFS potential population and is presented as a percentage. |
Target established: | National Agreement on Closing the Gap July 2020 |
Latest dashboard update: | 15 June 2023 |
Indicator type: | Target |
Interpretation of change: | A high or increasing proportion is desirable. |
Data source(s): | Name (numerator): Preschool Education, Australia Frequency: Annual Name (denominator): Estimates and Projections for Aboriginal and Torres Strait Islander population (revised data for 2017, 2018, 2019 and 2020 in the March 2022 Dashboard update). Frequency: Annual Documentation (links): https://www.abs.gov.au/statistics/people/education/preschool-education-australia (The data source for children with disability are State and Territory government department collections.) |
Data provider: | Provider name: Australian Bureau of Statistics Provider area: Preschool education (Demography for population data for remoteness area and socioeconomic status) (Data for children with disability are provided by State and Territory government departments.) |
Baseline year: | 2016 This is an existing National Indigenous Reform Agreement (NIRA) target. While the official baseline for this target is 2015, data are only comparable from 2016 onwards (see Data quality considerations). |
Latest reporting period: | 2022 |
Target year: | 2025 |
Disaggregations: | State and territory and Australia, by Indigenous status State and territory and Australia, by Indigenous status, by sex State and territory and Australia, by Indigenous status, by remoteness area State and territory and Australia, by Indigenous status, by Index of Relative Socioeconomic Disadvantage (IRSD) quintile State and territory and Australia, by Indigenous status, children with disability |
Computation: | Numerator divided by Denominator multiplied by 100 For remoteness and socioeconomic status, data on the number of children in the YBFS cohort are not available and therefore the 4-year-old population is used as a proxy to calculate rates. Counting rules The state-specific YBFS age cohort is an estimate of a single year cohort for the population that will transition to full time schooling in the following year. The state-specific YBFS definition uses the preschool and school age entry provisions of the state or territory in which the child usually resides. See Preschool Education, Australia methodology (http://www.abs.gov.au/methodologies/preschool-education-australia-methodology/) Numerator (all):
Numerator (Indigenous status, sex):
Numerator (disability):
Denominator (Indigenous status, sex, remoteness, socioeconomic status):
Denominator (remoteness and socioeconomic status)
Disaggregations:
|
Data quality considerations: | Data for Preschool Education, Australia are collected through the National Early Childhood Education and Care Collection (NECECC). Data are not fully comparable over time, or across jurisdictions, due to differences and changes in coverage and methodologies. See Preschool Education, Australia methodology (http://www.abs.gov.au/methodologies/preschool-education-australia-methodology/) for a description of the data collection methodologies and quality declarations. Data values have been randomly adjusted using perturbation to avoid the release of confidential data. Discrepancies may occur between sums of the component items and totals. Methods for the identification of Indigenous status vary by jurisdiction. For data supplied via the Australian Government's child care subsidy system (CCSS), children of families who choose not to identify as Aboriginal and/or Torres Strait Islander are classified as ‘non-Indigenous’ rather than ‘unknown/not stated’. Nationally in 2022, YBFS preschool enrolments with a ‘not stated’ Indigenous status were 0.5 per cent of all YBFS preschool enrolments. (Tasmania had the largest proportion with 4.5 per cent, followed by SA with 4.3 per cent). From 2018, and previously from 2016, the ABS improved the approach to data linkage in the NECECC. Improvements were made to the way records were linked (when representing the same child), within data provided by a jurisdiction, or across centre based day care data provided by both the Australian Government and State and Territory governments. These changes reduced over-counts of children enrolled in a preschool program. Enrolment proportions at the sub-national level (such as state and territory) may exceed 100 per cent for some areas due to the numerator and denominator being from different sources. The population (denominator) data are the best available estimates. However, the accuracy of population estimates tends to decrease the further away the year from the Census upon which they are based (currently the Dashboard uses population data based on the 2016 Census). Please see the How to interpret the data page for more information. The calculation of preschool enrolment rates for this indicator differs to the calculations used for reporting under the Preschool Reform Agreement (PRA) and the annual Report on Government Services (RoGS). The calculations reported for the PRA do not restrict to the year before full time schooling, and the RoGS does not prorate for unknown Indigenous status. Preschool enrolment data do not necessarily reflect whether a child regularly attends the preschool program. Tasmania and the ACT have relatively small Aboriginal and Torres Strait Islander populations compared to the other states and territories which means year-to-year variability in single year of age populations may be more pronounced. This may result in year-to-year variability of the rate of preschool enrolment in these jurisdictions and should be used with caution. Disaggregations:
|
Future reporting: | Additional disaggregations required for future reporting:
|
Supporting indicators
Contextual information
- Rate of attendance in early childhood education in the year before full-time schooling
- Number of Aboriginal and Torres Strait Islander early childhood education and care service providers
- Progress towards parity
Material for download
- Children are engaged in high quality, culturally appropriate early childhood education in their early years data tables (XLSX - 94 Kb)
- Children are engaged in high quality, culturally appropriate early childhood education in their early years dataset (CSV - 200 Kb)
To assist with interpretation of the data provided (Excel data tables and CSV dataset) please refer to the target data specification above.