Contextual information
Structural problems including functional health hardware
Australian Bureau of Statistics (ABS) measure of acceptable standard of housing
Dashboard snapshot: The data below are the most recent at the time of preparing the July 2023 report. Please go to the dashboard to access the current data.
Measure 1
Proportion of households living in housing of an acceptable standard
Nationally in 2018-19, 80.2 per cent of Aboriginal and Torres Strait Islander households reported living in houses classified as being of an acceptable standard (figure SE9e.1). Houses of an acceptable standard have four working facilities (for washing people, clothes or bedding, for storing/preparing food, and a working sewerage system) and no more than two major structural problems.
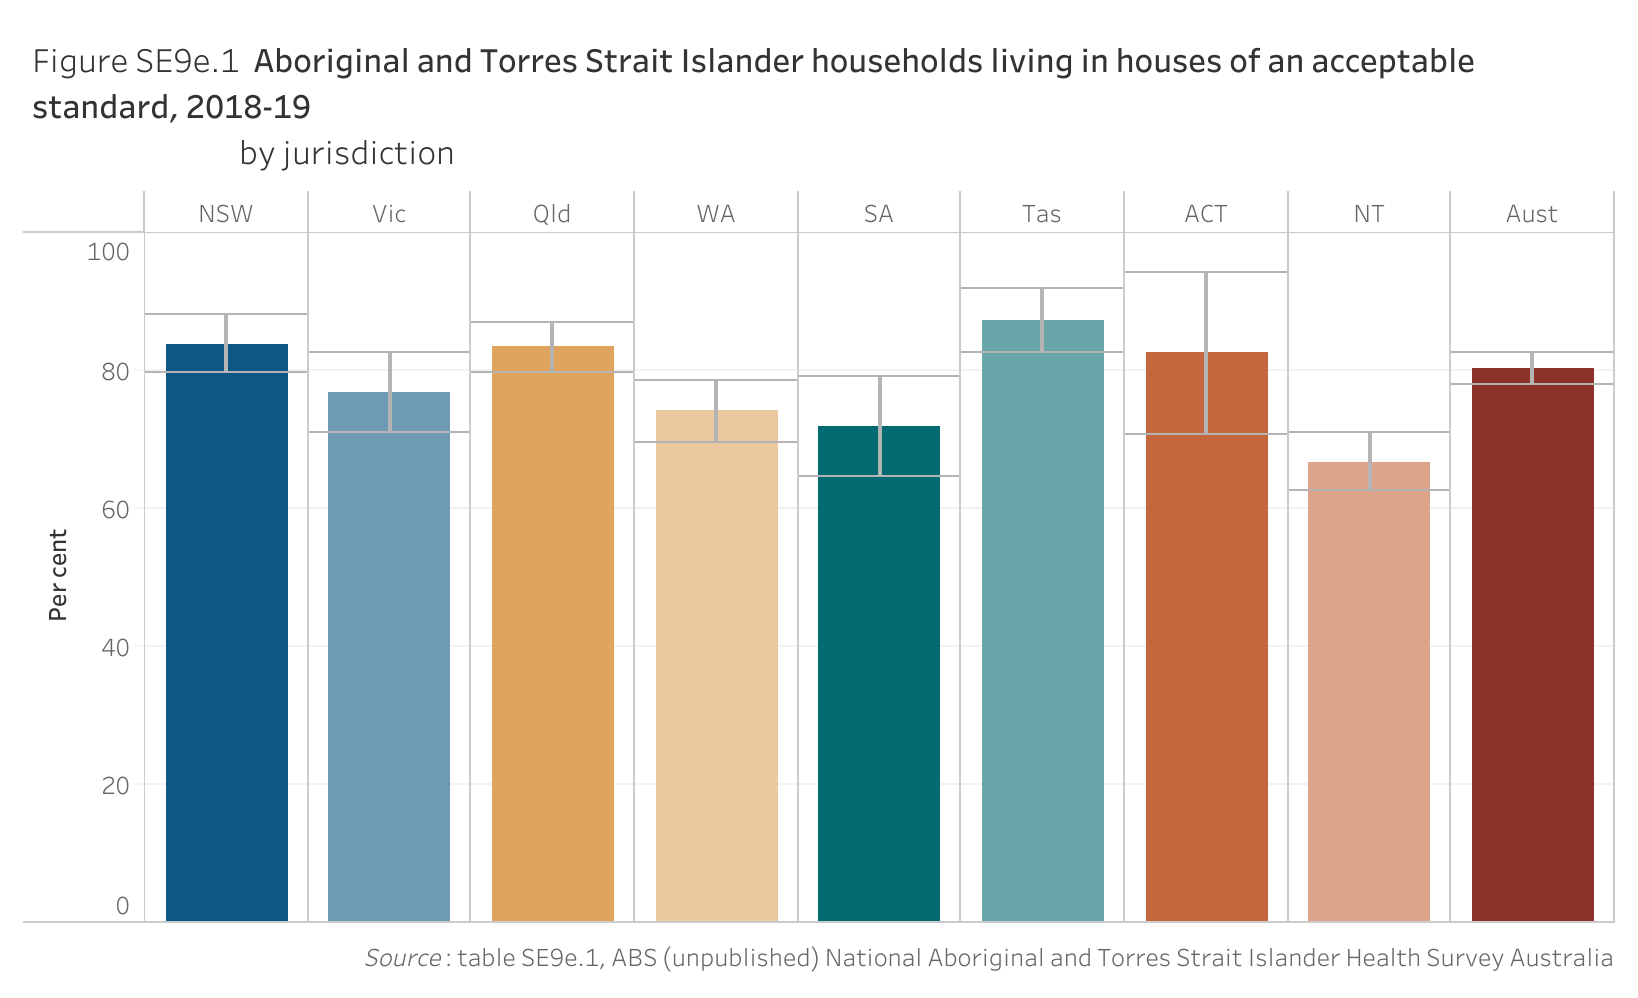
| Year | NSW | Vic | Qld | WA | SA | Tas | ACT | NT | Aust |
|---|---|---|---|---|---|---|---|---|---|
| 2018-19 | 83.9 | 76.9 | 83.4 | 74.1 | 71.8 | 87.2 | 82.5 | 66.8 | 80.2 |
Measure 2
Proportion of households living in dwellings with no major structural problems
Nationally in 2018-19, 67.1 per cent of Aboriginal and Torres Strait Islander households reported living in dwellings with no major structural problems (figure SE9e.2).
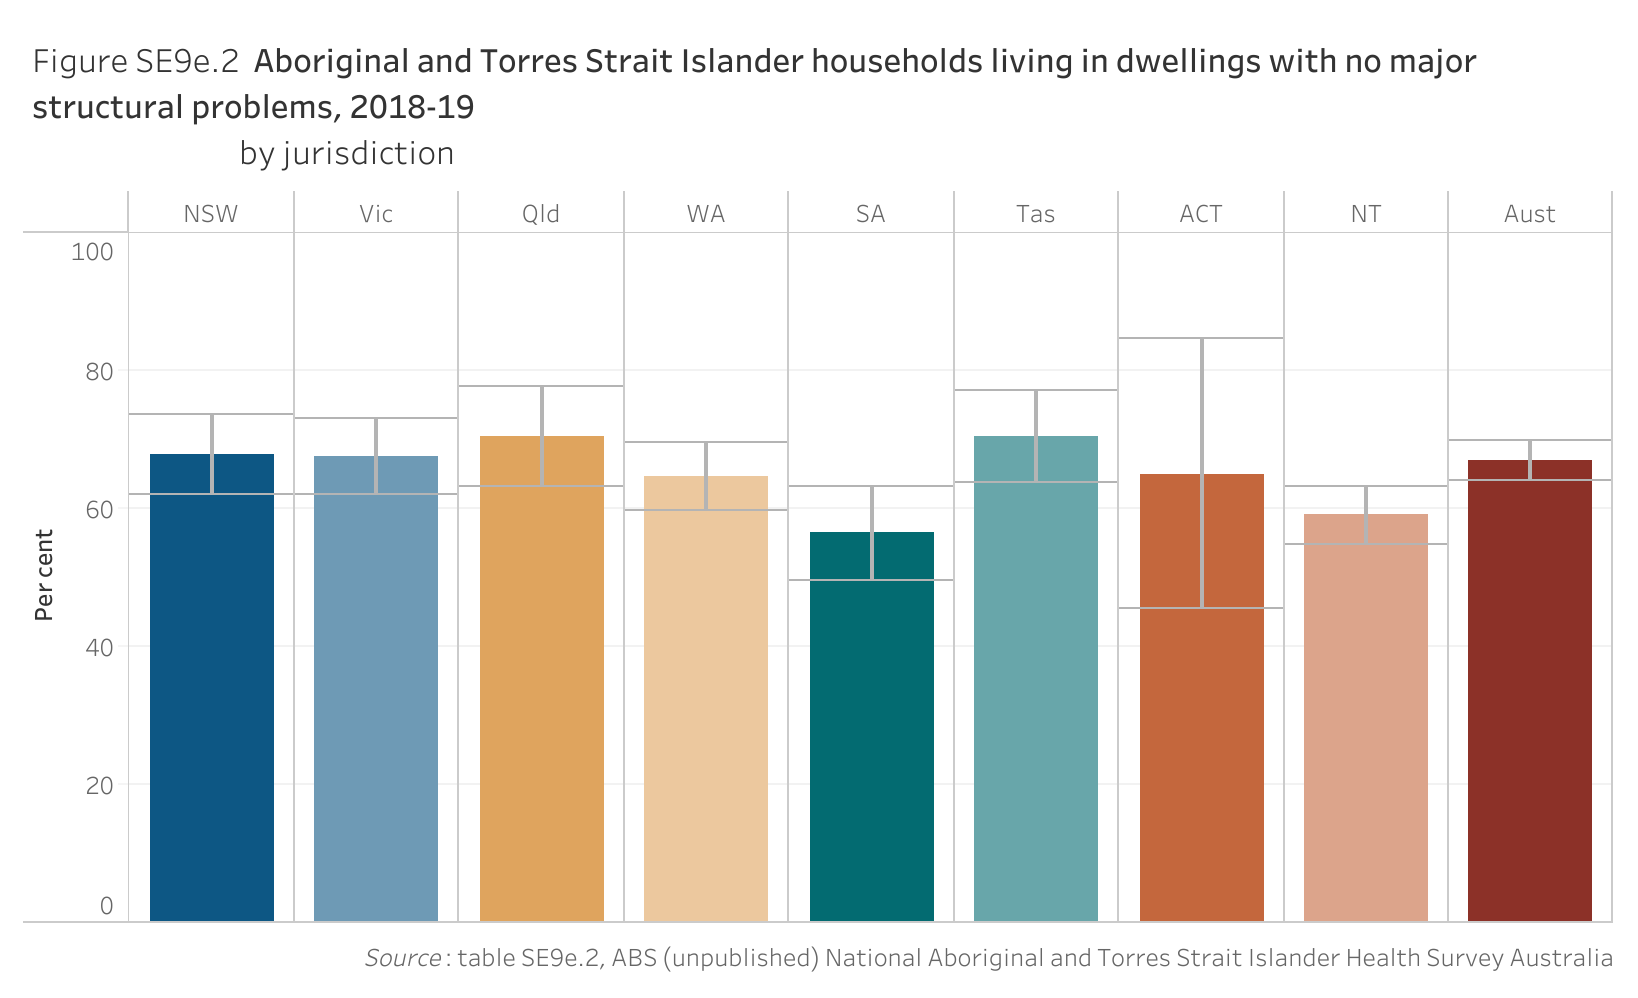
| Year | NSW | Vic | Qld | WA | SA | Tas | ACT | NT | Aust |
|---|---|---|---|---|---|---|---|---|---|
| 2018-19 | 67.8 | 67.6 | 70.5 | 64.6 | 56.4 | 70.5 | 65.0 | 59.0 | 67.1 |
Measure 3
Proportion of households living in dwellings with access to working facilities by separate facility type
Nationally in 2018-19, between 95.5 and 98.3 per cent of Aboriginal and Torres Strait Islander households reported living in dwellings with working facilities for washing people, clothes or bedding, and a working sewerage system. For storing and preparing food, the proportion was lower at 90.9 per cent (figure SE9e.3).
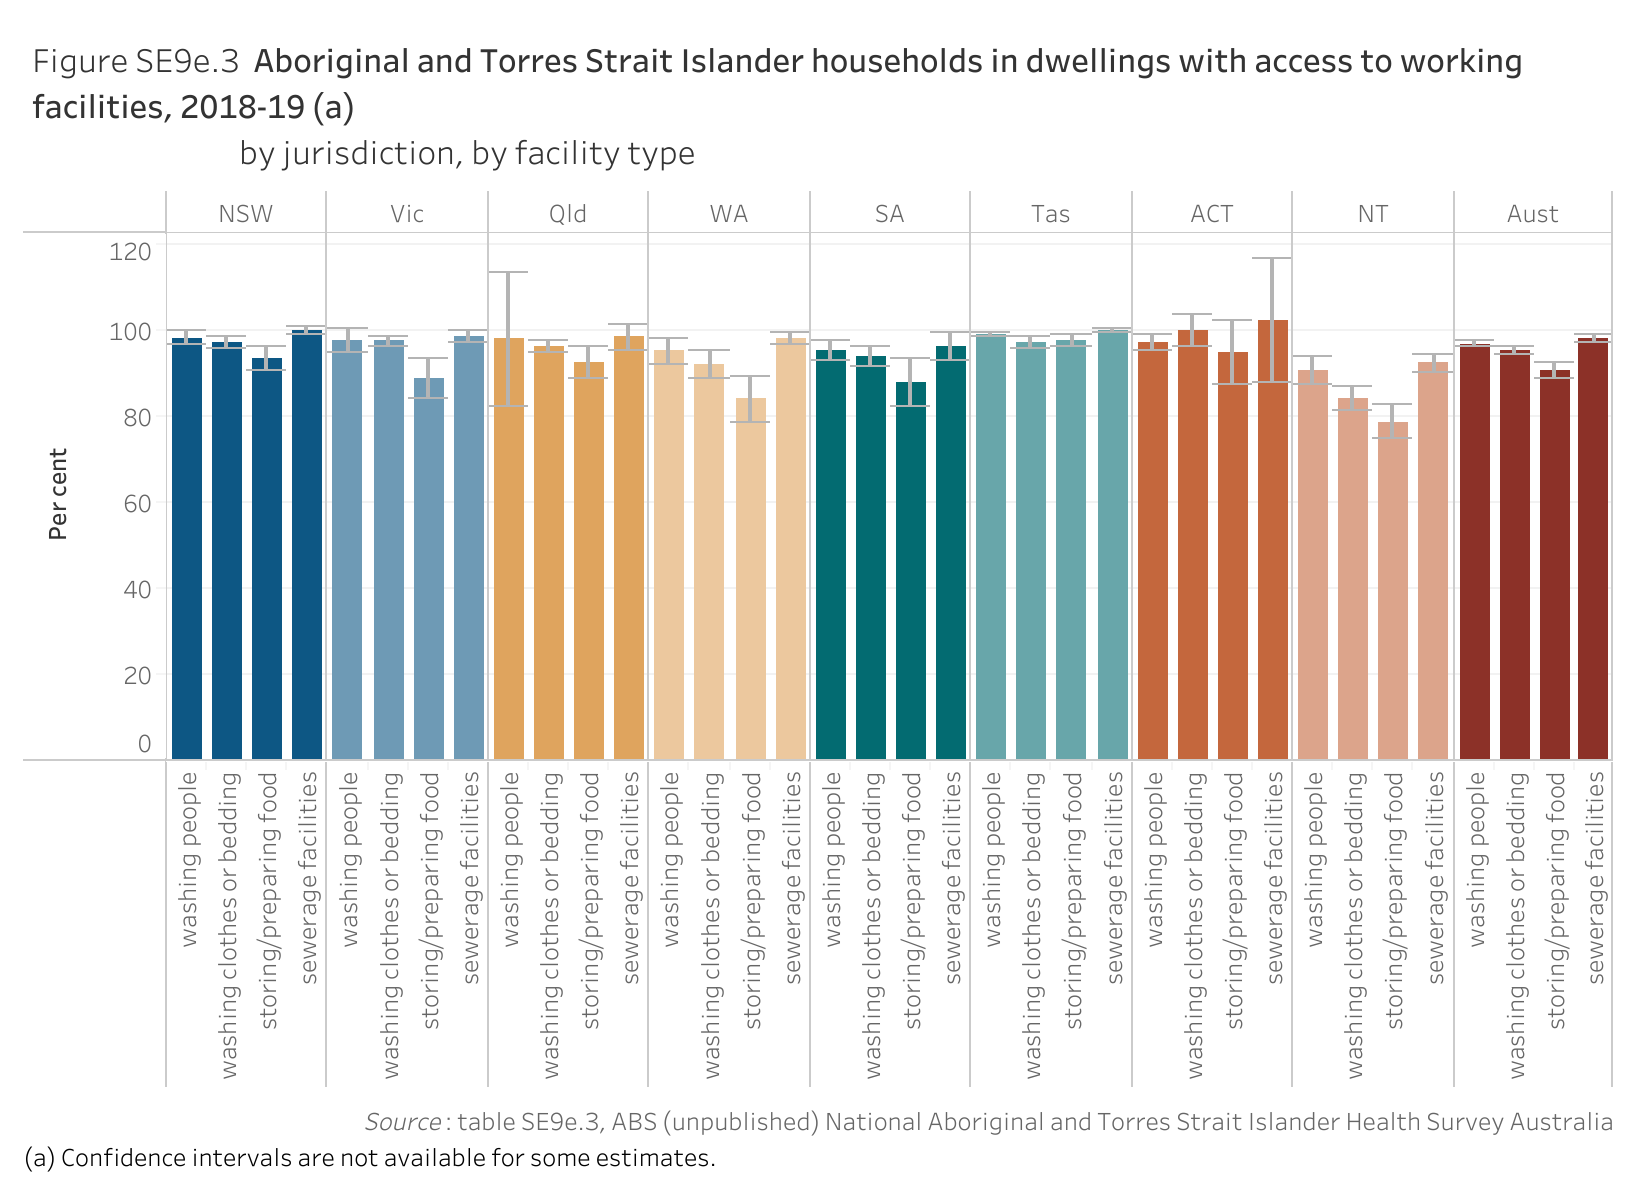
| Description5 | NSW | Vic | Qld | WA | SA | Tas | ACT | NT | Aust |
|---|---|---|---|---|---|---|---|---|---|
| washing people | 98.4 | 97.7 | 98.2 | 95.4 | 95.5 | 99.3 | 97.5 | 90.8 | 97.1 |
| washing clothes or bedding | 97.4 | 97.7 | 96.5 | 92.3 | 94.1 | 97.3 | 100.0 | 84.3 | 95.5 |
| storing/preparing food | 93.7 | 89.0 | 92.8 | 84.1 | 88.1 | 98.0 | 95.0 | 78.8 | 90.9 |
| sewerage facilities | 100.0 | 98.7 | 98.6 | 98.2 | 96.5 | 100.0 | 102.5 | 92.6 | 98.3 |
Indicator data specifications
Related Outcome: | Aboriginal and Torres Strait Islander children secure appropriate, affordable housing that is aligned with their priorities and need |
|---|---|
Related target: | By 2031, increase the proportion of Aboriginal and Torres Strait Islander people living in appropriately sized (not overcrowded) housing to 88 per cent |
Indicator: | Structural problems including functional health hardware (ABS measure of acceptable standard of housing) |
Measures: | There are three measures for this indicator. Measure 1 is the proportion of households living in housing of an acceptable standard, defined as: Numerator — number of Aboriginal and Torres Strait Islander households living in housing of an acceptable standard Denominator — number of Aboriginal and Torres Strait Islander households and is presented as a percentage. Measure 2 is the proportion of households living in dwellings with no major structural problems, defined as: Numerator — number of Aboriginal and Torres Strait Islander households living in dwellings with no major structural problems Denominator — number of Aboriginal and Torres Strait Islander households and is presented as a percentage. Measure 3 is the proportion of households living in dwellings with access to working facilities by separate facility type, defined as: Numerator — number of Aboriginal and Torres Strait Islander households living in dwellings with working facilities by separately facility type Denominator — number of Aboriginal and Torres Strait Islander households and is presented as a percentage. |
Indicator established: | National Agreement on Closing the Gap July 2020 |
Latest dashboard update for the indicator: | 30 June 2022 |
Indicator type: | Contextual information |
Interpretation of change: | For all measures, a high or increasing proportion is desirable. |
Data source(s): | Name: National Aboriginal and Torres Strait Islander Social Survey (NATSISS)/National Aboriginal and Torres Strait Islander Health Survey (NATSIHS) Frequency: 6-yearly (NATSISS and NATSIHS) – roughly 3-yearly rotating cycle Documentation (links): |
Data provider: | Provider name: Australian Bureau of Statistics Provider area: Centre for Aboriginal and Torres Strait Islander Statistics |
Baseline year: | 2018-19 |
Latest reporting period: | 2018-19 |
Disaggregations: | (All measures) State and territory and Australia |
Computation: | Numerator divided by Denominator multiplied by 100 Counting rules Data are for all Aboriginal and Torres Strait Islander households that live in private dwellings in Australia, including, among others, public and community housing. In the NATSIHS, an Aboriginal and/or Torres Strait Islander household is defined as an occupied private dwelling where at least one permanent resident identifies as being of Aboriginal and/or Torres Strait Islander origin. Geographical variables are based on the usual place of residence of the household. The ABS definition of ‘acceptable standard’ is used which is defined as housing with four working facilities (for washing people, for washing clothes or bedding, for storing/preparing food and sewerage) and not more than two major structural problems. ABS TableBuilder has been used to source data for this indicator (all measures). Numbers in TableBuilder are rounded to the nearest 100. Proportions are calculated from rounded values. Supporting calculations
|
Data quality considerations: | See the NATSIHS methodology for further information on the 2018-19 data: https://www.abs.gov.au/methodologies/national-aboriginal-and-torres-strait-islander-health-survey-methodology/2018-19 Data have been randomly adjusted using perturbation to avoid the release of confidential data. Discrepancies may occur between sums of the component items and totals. Data for this measure align with that for similar measures in the Overcoming Indigenous Disadvantage report and the Aboriginal and Torres Strait Islander Health Performance Framework report. Data from the NATSIHS and NATSISS are ‘self-reported’ and are based on the respondent’s view of their housing and its functionality. |
Future reporting: | Additional disaggregations required for future reporting:
|