Report on Government Services 2016
Chapter 7, Volume C
Courts
The focus of the Courts chapter (chapter 7) is the court administration functions of Australian and State and Territory courts.
Data are reported for the Federal Court, the Family Court of Australia and the Federal Circuit Court, the criminal and civil jurisdictions of the supreme courts (including probate registries), district/county courts, magistrates' courts (including children's courts), coroners' courts and the Family Court of WA.
Download the chapter
- Chapter 7 Courts, attachment tables, and data quality information (PDF - 2686 Kb)
- Chapter 7 Attachment tables (XLSX - 1044 Kb)
- Key Facts
- Indicator Framework
- Indicator Results
The focus of this chapter is the court administration functions of Australian and State and Territory courts. Data are reported for the Federal Court, the Family Court of Australia and the Federal Circuit Court, the criminal and civil jurisdictions of the supreme courts (including probate registries), district/county courts, magistrates' courts (including children's courts), coroners' courts and the Family Court of WA.
- In 2014-15, in the criminal jurisdiction of the supreme, district/county, magistrates' and children's courts, approximately 890 300 cases were lodged, and 918 900 cases were finalised.
- In the civil jurisdiction of these same courts approximately 442 300 cases were lodged and 457 400 cases finalised.
- In the Australian courts, approximately 120 600 cases were lodged, and approximately 114 000 cases finalised.
Total court administration recurrent expenditure less income (excluding fines) by the court authorities covered in this chapter was approximately $1.37 billion in 2014-15, comprising $1.14 billion for the State and Territory courts and $228.2 million for the Australian courts.
Courts aim to:
- be open and accessible
- process matters in an expeditious and timely manner
- provide due process and equal protection before the law
- be independent yet publicly accountable for performance.
In addition, all governments aim to provide court services in an efficient manner.
The performance indicator framework provides information on equity, efficiency and effectiveness, and distinguishes the outputs and outcomes of courts. The performance indicator framework shows which data are complete and comparable in the 2016 Report.
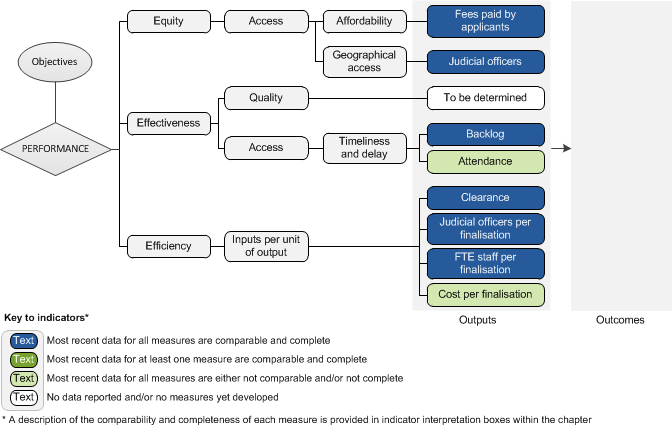
An overview of the Courts performance indicator results are presented. Information to assist the interpretation of these data can be found in the indicator interpretation boxes in the Courts chapter and attachment tables.
Equity — Access indicators
Fees paid by applicants
Average civil court fees collected per lodgment ($), 2014-15
| NSW | Vic | Qld | WA | SA | Tas | ACT | NT | Aus Gov | Aust | |
|---|---|---|---|---|---|---|---|---|---|---|
| Supreme / Federal (excl. probate) | 2930 | 1702 | 1936 | 2181 | 2961 | 629 | 2403 | 1552 | 3747 | 2455 |
| District / County | 1649 | 1592 | 976 | 989 | 976 | .. | .. | .. | .. | 1324 |
| Magistrates | 163 | 219 | 119 | 130 | 115 | 85 | 217 | 57 | .. | 160 |
| Family | .. | .. | .. | 405 | .. | .. | .. | .. | 218 | 298 |
| Federal Circuit | .. | .. | .. | .. | .. | .. | .. | .. | 558 | 558 |
Judicial officers
Total number of full time equivalent (FTE) judicial officers, 2014-15
| NSW | Vic | Qld | WA | SA | Tas | ACT | NT | Aus Gov | Aust | |
|---|---|---|---|---|---|---|---|---|---|---|
| No. | 261.3 | 248.0 | 156.3 | 125.5 | 69.9 | 21.4 | 13.6 | 25.8 | 150.1 | 1071.8 |
Number of FTE judicial officers per 100 000 population, 2014-15
| NSW | Vic | Qld | WA | SA | Tas | ACT | NT | Aus Gov | Aust | |
|---|---|---|---|---|---|---|---|---|---|---|
| No. | 3.5 | 4.2 | 3.3 | 4.9 | 4.1 | 4.2 | 3.5 | 10.5 | 0.6 | 4.5 |
Effectiveness - Access indicators
Backlog
Percentage of criminal lodgments pending completion at 30 June, 2015 (%)
| NSW | Vic | Qld | WA | SA | Tas | ACT | NT | Aus Gov | Aust | |
|---|---|---|---|---|---|---|---|---|---|---|
| Higher (appeal) >12 months | 2.6 | 4.9 | 10.3 | 15.9 | 11.2 | 7.7 | 30.6 | 11.1 | .. | .. |
| Higher (appeal) >24 months | 0.5 | 0.6 | 2.7 | 0.0 | 1.5 | 3.8 | 0.0 | 0.0 | .. | .. |
| Higher (non-appeal) >12 months | 18.1 | 22.0 | 14.3 | 6.8 | 21.8 | 27.6 | 15.3 | 4.5 | .. | .. |
| Higher (non-appeal) >24 months | 3.7 | 2.3 | 4.5 | 0.6 | 5.1 | 8.8 | 3.8 | – | .. | .. |
| Magistrates >6 months | 12.6 | 23.2 | 31.3 | 28.3 | 23.6 | 32.3 | 27.1 | 31.2 | .. | .. |
| Magistrates >12 months | 2.0 | 7.0 | 13.3 | 8.9 | 7.8 | 13.8 | 8.6 | 15.6 | .. | .. |
| Children's >6 months | 13.4 | 10.3 | 27.4 | 13.2 | 20.3 | 27.9 | 36.5 | 32.3 | .. | .. |
| Children's >12 months | 1.6 | 2.9 | 14.1 | 3.1 | 6.8 | 12.1 | 17.4 | 16.8 | .. | .. |
Percentage of civil lodgments pending completion at 30 June, 2015 (%)
| NSW | Vic | Qld | WA | SA | Tas | ACT | NT | Aus Gov | Aust | |
|---|---|---|---|---|---|---|---|---|---|---|
| Higher (appeal) >12 months | 15.4 | 16.3 | 19.5 | 14.2 | 8.3 | 11.3 | 47.4 | 6.5 | 6.5 | .. |
| Higher (appeal) >24 months | 2.5 | 4.2 | 4.7 | 1.8 | 1.0 | 1.6 | 26.3 | – | 0.6 | .. |
| Higher (non-appeal) >12 months | 25.3 | 29.0 | 21.7 | 37.7 | 44.6 | 34.9 | 36.7 | 33.7 | 39.9 | .. |
| Higher (non-appeal) >24 months | 8.1 | 11.6 | 5.2 | 13.2 | 22.4 | 11.0 | 11.5 | 11.6 | 24.6 | .. |
| Magistrates >6 months | 25.1 | 25.7 | 47.9 | 46.2 | 41.4 | 43.9 | 41.5 | 46.7 | .. | .. |
| Magistrates >12 months | 0.8 | 15.6 | 10.6 | 10.1 | 11.1 | 12.3 | 17.1 | 7.2 | .. | .. |
| Family (appeal) >12 months | .. | .. | .. | – | .. | .. | .. | .. | 30.8 | .. |
| Family (appeal) >24 months | .. | .. | .. | – | .. | .. | .. | .. | 13.8 | .. |
| Family (non-appeal) >12 months | .. | .. | .. | 25.0 | .. | .. | .. | .. | 26.3 | .. |
| Family (non-appeal) >24 months | .. | .. | .. | 6.0 | .. | .. | .. | .. | 10.5 | .. |
| Federal Circuit >6 months | .. | .. | .. | .. | .. | .. | .. | .. | 33.6 | .. |
| Federal Circuit >12 months | .. | .. | .. | .. | .. | .. | .. | .. | 13.9 | .. |
| Coroners' >12 months | 27.9 | 31.9 | 25.9 | 19.6 | 35.4 | 33.2 | 38.7 | 37.2 | .. | .. |
| Coroners' >24 months | 18.6 | 15.4 | 12.0 | 8.4 | 12.9 | 12.5 | 24.1 | 22.2 | .. | .. |
Attendance
Average number of attendances per finalisation, criminal courts 2014-15
| NSW | Vic | Qld | WA | SA | Tas | ACT | NT | Aus Gov | Aust | |
|---|---|---|---|---|---|---|---|---|---|---|
| Supreme | na | na | 4.0 | 2.9 | 3.5 | 7.0 | 6.6 | 6.8 | .. | .. |
| District / County | 3.2 | 4.7 | 4.3 | 3.7 | 6.1 | .. | .. | .. | .. | .. |
| Magistrates | 2.6 | 2.0 | 2.5 | 2.5 | 3.9 | 4.0 | 3.7 | 3.3 | .. | .. |
| Children's | 3.6 | 2.2 | 2.7 | 3.8 | 3.9 | 5.1 | 3.9 | 4.8 | .. | .. |
Average number of attendances per finalisation, civil courts 2014-15
| NSW | Vic | Qld | WA | SA | Tas | ACT | NT | Aus Gov | Aust | |
|---|---|---|---|---|---|---|---|---|---|---|
| Supreme/Federal | na | na | 1.2 | 2.2 | 4.0 | 1.8 | 5.9 | 4.2 | 3.2 | .. |
| District / County | 3.7 | 0.8 | 0.4 | 1.2 | 4.0 | .. | .. | .. | .. | .. |
| Magistrates | 0.8 | 1.1 | 0.9 | 0.8 | 1.1 | 1.1 | 1.6 | 1.1 | .. | .. |
| Children's | na | 1.8 | 3.5 | 4.0 | 2.5 | 5.4 | 5.7 | 3.7 | .. | .. |
| Family | .. | .. | .. | 1.8 | .. | .. | .. | .. | 2.2 | .. |
| Federal Circuit | .. | .. | .. | .. | .. | .. | .. | .. | 1.9 | .. |
| Coroners' | 4.0 | 1.0 | 3.8 | 2.7 | 1.9 | 1.0 | 3.4 | 1.0 | .. | .. |
Efficiency indicators
Clearance
Finalisations divided by lodgments (multiplied by 100 to provide percentage), criminal, 2014-2015
| NSW | Vic | Qld | WA | SA | Tas | ACT | NT | Aus Gov | Aust | |
|---|---|---|---|---|---|---|---|---|---|---|
| Supreme (appeal) | 127.2 | 107.0 | 94.4 | 104.9 | 89.4 | 74.3 | 95.7 | 111.8 | .. | .. |
| Supreme (non-appeal) | 105.8 | 83.5 | 89.6 | 88.9 | 92.0 | 90.0 | 90.5 | 85.0 | .. | .. |
| District/County (appeal) | 98.3 | 108.4 | 91.1 | .. | .. | .. | .. | .. | .. | .. |
| District/County (non-appeal) | 85.9 | 105.3 | 96.5 | 76.0 | 92.5 | .. | .. | .. | .. | .. |
| Magistrates | 101.1 | 111.5 | 97.4 | 103.4 | 102.7 | 91.9 | 95.7 | 103.9 | .. | .. |
| Children's | 100.0 | 103.3 | 102.4 | 104.6 | 110.0 | 98.9 | 102.6 | 103.2 | .. | .. |
Finalisations divided by lodgments (multiplied by 100 to provide percentage), civil, 2014-2015
| NSW | Vic | Qld | WA | SA | Tas | ACT | NT | Aus Gov | Aust | |
|---|---|---|---|---|---|---|---|---|---|---|
| Supreme (appeal) | 111.9 | 111.0 | 75.5 | 81.6 | 91.0 | 85.1 | 116.1 | 95.5 | 84.2 | .. |
| Supreme (non-appeal) | 110.9 | 92.1 | 101.7 | 98.0 | 97.9 | 103.7 | 106.4 | 99.3 | 91.4 | .. |
| District/County (appeal) | 118.7 | 181.6 | 91.8 | 99.2 | 102.7 | .. | .. | .. | .. | .. |
| District/County (non-appeal) | 94.9 | 99.9 | 100.7 | 96.1 | 142.4 | .. | .. | .. | .. | .. |
| Magistrates | 105.1 | 108.2 | 104.8 | 96.9 | 102.7 | 106.8 | 104.2 | 98.6 | .. | .. |
| Children's | 95.1 | 86.5 | 98.4 | 105.1 | 88.1 | 121.2 | 72.3 | 102.5 | .. | .. |
| Family (appeal) | .. | .. | .. | 133.3 | .. | .. | .. | .. | 91.5 | .. |
| Family (non-appeal) | .. | .. | .. | 93.5 | .. | .. | .. | .. | 98.6 | .. |
| Federal Circuit | .. | .. | .. | .. | .. | .. | .. | .. | 93.9 | .. |
| Coroners' | 106.1 | 108.5 | 93.1 | 92.2 | 106.6 | 90.2 | 104.4 | 91.1 | .. | .. |
Judicial officers per 100 finalisations
Full time equivalent judicial officers divided by total finalisations (multiplied by 100), 2014-15
| NSW | Vic | Qld | WA | SA | Tas | ACT | NT | Aus Gov | Aust | |
|---|---|---|---|---|---|---|---|---|---|---|
| Supreme/Federal | 0.57 | 0.75 | 0.50 | 0.98 | 0.88 | 0.50 | 0.60 | 0.96 | 1.41 | 0.75 |
| District/County | 0.37 | 0.51 | 0.33 | 0.41 | 0.40 | .. | .. | .. | .. | 0.40 |
| Magistrates | 0.04 | 0.03 | 0.03 | 0.03 | 0.04 | 0.05 | 0.07 | 0.06 | .. | 0.03 |
| Children's | 0.12 | 0.04 | 0.04 | 0.05 | 0.06 | 0.09 | 0.13 | 0.06 | .. | 0.06 |
| Family | .. | .. | .. | 0.10 | .. | .. | .. | .. | 0.16 | .. |
| Federal Circuit | .. | .. | .. | .. | .. | .. | .. | .. | 0.07 | 0.07 |
| Coroners' | 0.08 | 0.13 | 0.17 | 0.20 | 0.08 | 0.51 | 0.09 | 0.57 | .. | 0.14 |
| Total | 0.07 | 0.06 | 0.05 | 0.07 | 0.08 | 0.08 | 0.11 | 0.10 | 0.13 | 0.07 |
Full time equivalent staff per 100 finalisations
Number of full time equivalent staff divided by total finalisations (multiplied by 100), 2014-15
| NSW | Vic | Qld | WA | SA | Tas | ACT | NT | Aus Gov | Aust | |
|---|---|---|---|---|---|---|---|---|---|---|
| Criminal courts | 0.7 | 0.3 | 0.3 | 0.5 | 0.7 | 0.5 | 1.0 | 0.4 | .. | 0.4 |
| Civil courts | 0.7 | 0.6 | 0.4 | 0.5 | 0.5 | 0.5 | 1.1 | 0.7 | 7.8 | 0.6 |
| Family courts | .. | .. | .. | 1.0 | .. | .. | .. | .. | 1.2 | 1.1 |
| Federal Circuit | .. | .. | .. | .. | .. | .. | .. | .. | 0.6 | 0.6 |
| Coroners' | 0.7 | 1.1 | 1.3 | 1.5 | 0.9 | 1.1 | 0.8 | 1.7 | .. | 1.0 |
| Total | 0.7 | 0.4 | 0.3 | 0.5 | 0.6 | 0.5 | 1.0 | 0.5 | 0.9 | 0.5 |
Cost per finalisation
Total recurrent expenditure (minus income) divided by total finalisations, criminal, 2014-15 ($)
| NSW | Vic | Qld | WA | SA | Tas | ACT | NT | Aus Gov | Aust | |
|---|---|---|---|---|---|---|---|---|---|---|
| Supreme | 37 073 | 50 404 | 10 015 | 26 013 | 31 173 | 17 078 | 24 275 | 19 194 | .. | 23 202 |
| District/County | 6158 | 14 757 | 7557 | 20 535 | 9494 | .. | .. | .. | .. | 9596 |
| Magistrates | 619 | 327 | 403 | 768 | 764 | 530 | 1212 | 798 | .. | 502 |
| Children's | 700 | 177 | 637 | 985 | 740 | 577 | 3781 | 806 | .. | 546 |
Total recurrent expenditure (minus income) divided by total finalisations, civil, 2014-15 ($)
| NSW | Vic | Qld | WA | SA | Tas | ACT | NT | Aus Gov | Aust | |
|---|---|---|---|---|---|---|---|---|---|---|
| Supreme (excluding probate)/Federal | 4546 | 5648 | 4373 | 7933 | 5027 | 3456 | 6276 | 17 088 | 21 000 | 7387 |
| District/County | 3389 | 3128 | 1030 | 2345 | 2436 | .. | .. | .. | .. | 2558 |
| Magistrates | 254 | 193 | 261 | 252 | 178 | 220 | 1293 | 789 | .. | 254 |
| Children's | 776 | 2297 | 1302 | 642 | 498 | 696 | 3624 | 816 | .. | 1276 |
| Family | .. | .. | .. | 1553 | .. | .. | .. | .. | 3123 | .. |
| Federal Circuit | .. | .. | .. | .. | .. | .. | .. | .. | 916 | 916 |
| Coroners' | 874 | 1776 | 2096 | 2807 | 1360 | 1962 | 1925 | 3838 | .. | 1685 |
Legend
a Caveats for these data are available in Chapter 7 and Attachment 7A. Refer to the indicator interpretation boxes in chapter 7 for information to assist with interpreting data presented in this table.
b These data are derived from detailed data in Chapter 7 and Attachment 7A. na Not available.
.. Not applicable.
– Nil or rounded to zero.
Source: Chapter 7 and Attachment 7A.