Report on Government Services 2018
Part F, Chapter 14
Aged care services
This chapter focuses on government funded care and support services for older people and their carers, which are provided at home, in the community and in residential care facilities.
Download the chapter
- Chapter 14 Aged care services and attachment tables (PDF - 2540 Kb)
- Chapter 14 Aged care services (Word - 191 Kb)
- Chapter 14 Attachment tables (XLSX - 1015 Kb)
- Key Facts
- Indicator Framework
- Indicator Results
- Indigenous Data
Total government expenditure reported on aged care services in 2016-17 was $17.4 billion. This comprised expenditure of $12.1 billion on residential care services, $4.4 billion on home care and support services and $907 million on other services, such as flexible care and assessments.
As at June 2017, there were 204 335 operational places (including flexible places) in residential care services, and 71 423 recipients of Home Care Packages Level 1–4.
During 2016-17, there were 66 041 older clients receiving Home Care Packages Level 1‑2, 33 136 older clients receiving Home Care Packages Level 3‑4, 704 928 older clients of the Commonwealth Home Support Program and 62 846 older HACC clients in WA. There were also 232 252 older clients who received permanent care and 57 498 who received respite care in a residential aged care facility during that period.
The aged care system aims to promote the wellbeing and independence of older people (and their carers), by enabling them to stay in their own homes or by assisting them in residential care. Governments seek to achieve this aim by subsidising aged care services that are:
- accessible — including timely and affordable
- appropriate to meet the needs of clients — person-centred, with an emphasis on integrated care, ageing in place and restorative approaches
- high quality.
Governments aim for aged care services to meet these objectives in an equitable and efficient manner.
The performance indicator framework provides information on equity, efficiency and effectiveness, and distinguishes the outputs and outcomes of government aged care services. The performance indicator framework shows which data are complete and comparable in the 2018 Report.
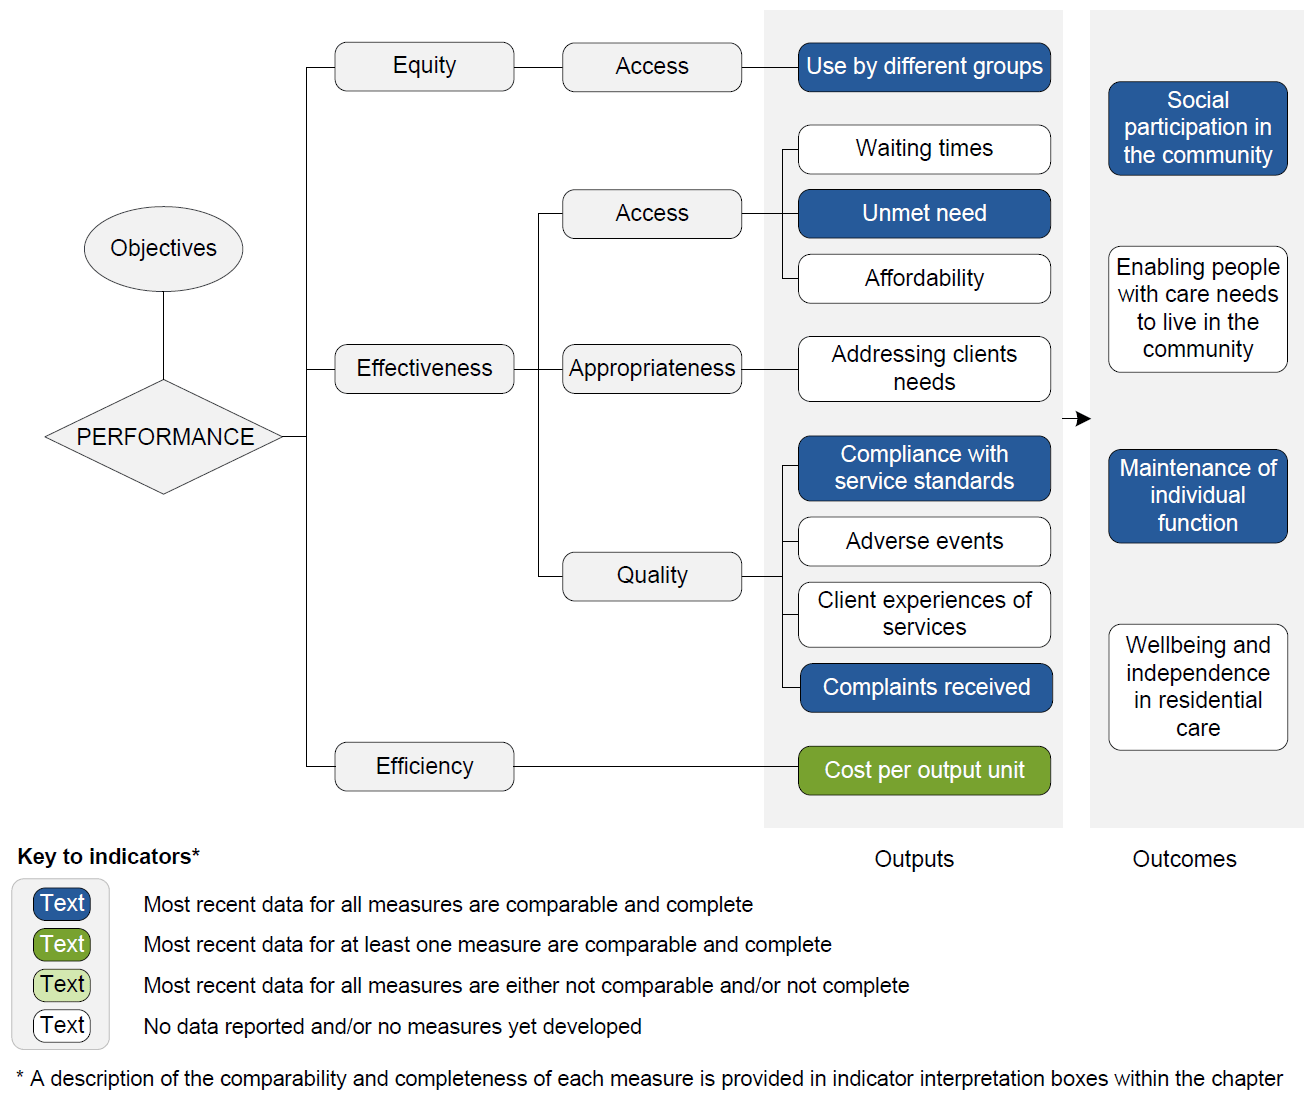
An overview of the Aged care services performance indicator results are presented. Information to assist the interpretation of these data can be found in the indicator interpretation boxes in the Aged care services chapter and attachment tables.
Equity — Access indicators
Use by different groups
Proportion of service clients who are Aboriginal and Torres Strait Islander Australians, compared with the proportion of the aged care target population who are Aboriginal and Torres Strait Islander Australians (per cent)
| NSW | Vic | Qld | WA | SA | Tas | ACT | NT | Aust | |
|---|---|---|---|---|---|---|---|---|---|
| Aged care target population, June 2017 | 3.0 | 0.8 | 4.1 | 3.9 | 2.0 | 4.6 | 1.8 | 43.0 | 3.0 |
| ACAT assessments, 2015-16 | 1.6 | 0.6 | 2.0 | 2.3 | 1.0 | 1.0 | 0.9 | 38.7 | 1.5 |
| Residential aged care, 30 June 2017 | 0.8 | 0.3 | 1.5 | 1.9 | 0.5 | 0.7 | 0.3 | 37.3 | 0.9 |
| Home care levels 1–2, 30 June 2017 | 4.3 | 3.6 | 4.6 | 5.7 | 2.7 | 2.2 | 5.9 | 67.8 | 4.9 |
| Home care levels 3–4, 30 June 2017 | 2.4 | 1.9 | 3.5 | 2.7 | 2.1 | 2.2 | 0.6 | 27.7 | 2.7 |
| Transition care, 2016-17 | 1.5 | – | 0.5 | 1.3 | 0.7 | 5.5 | – | – | 0.9 |
Effectiveness — Access indicators
Unmet need
Proportion of all hospital patient days (for overnight separations only) that were for aged care type, 2015‑16
| NSW | Vic | Qld | WA | SA | Tas | ACT | NT | Aust | |
|---|---|---|---|---|---|---|---|---|---|
| % | 10.2 | 0.6 | 17.8 | 17.5 | 21.2 | 12.7 | 27.6 | 13.3 | 11.3 |
Effectiveness — Quality indicators
Compliance with service standards
Proportion of all re-accredited residential aged care facilities that have been granted a re-accreditation approval for a period of three years, as at 30 June 2017
| NSW | Vic | Qld | WA | SA | Tas | ACT | NT | Aust | |
|---|---|---|---|---|---|---|---|---|---|
| % | 98.2 | 99.7 | 96.6 | 97.4 | 97.2 | 100.0 | 96.0 | 91.7 | 98.2 |
Proportion of Australian Government home care and support service providers reviewed that achieved all expected outcomes for each of the three standards, 30 June 2017 (per cent)
| NSW | Vic | Qld | WA | SA | Tas | ACT | NT | Aust | |
|---|---|---|---|---|---|---|---|---|---|
| Standard 1 — Effective management | 86.9 | 94.6 | 85.3 | 91.7 | 88.7 | 90.7 | 97.0 | 78.1 | 88.0 |
| Standard 2 — Appropriate access and service delivery | 90.8 | 97.9 | 95.7 | 94.5 | 87.1 | 96.9 | 97.0 | 78.1 | 92.8 |
| Standard 3 — Service user rights and responsibilities | 98.3 | 99.7 | 98.3 | 97.2 | 97.8 | 100.0 | 100.0 | 93.8 | 98.3 |
Compliants received
Number of in-scope complaints received by the Aged Care Complaints Commissioner per 1000 care recipients, 2016-17
| NSW | Vic | Qld | WA | SA | Tas | ACT | NT | Aust | |
|---|---|---|---|---|---|---|---|---|---|
| no. | 26.0 | 27.1 | 29.5 | 21.2 | 21.6 | 28.3 | 30.9 | 71.3 | 26.4 |
Efficiency indicators
Cost per output unit
Australian Government expenditure on aged care assessments, per completed assessment, 2015‑16
| NSW | Vic | Qld | WA | SA | Tas | ACT | NT | Aust | |
|---|---|---|---|---|---|---|---|---|---|
| $ | 730.20 | 603.72 | 712.40 | 765.25 | 799.49 | 750.87 | 660.85 | 1 920.00 | 705.34 |
Outcome indicators
Social participation in the community
Proportion of older people (aged 65 years or over) who did not leave home or did not leave home as often as they would like, 2015 (per cent)
| NSW | Vic | Qld | WA | SA | Tas | ACT | NT | Aust | |
|---|---|---|---|---|---|---|---|---|---|
| With profound or severe disability | 48.0 ± 6.6 | 43.3 ± 7.1 | 43.7 ± 7.5 | 40.2 ± 9.8 | 52.9 ± 8.3 | 47.7 ± 13.6 | 40.0 ± 9.0 | 47.1 ± 16.5 | 45.6 ± 3.3 |
| Without disability | 6.6 ± 1.9 | 7.7 ± 1.8 | 5.3 ± 1.8 | 6.1 ± 2.3 | 7.3 ± 2.0 | 3.3 ± 2.5 | 3.6 ± 2.8 | np | 6.5 ± 0.8 |
Maintenance of individual functioning
Improvement in the level of physical function for Transition Care Program (TCP) clients, reflected in the movement from the average Modified Barthel Index (MBI) score on entry to the average MBI score on exit, 2016‑17 (number)
| NSW | Vic | Qld | WA | SA | Tas | ACT | NT | Aust | |
|---|---|---|---|---|---|---|---|---|---|
| Average MBI on entry | 80 | 65 | 72 | 55 | 69 | 67 | 85 | 83 | 71 |
| Average MBI on exit | 91 | 72 | 83 | 63 | 85 | 83 | 96 | 92 | 81 |
Notes
These data and caveats for these data are available in chapter 14 and attachment 14A.
Some percentages reported in these tables include 95 per cent confidence intervals (for example, 80 per cent ± 2.7 per cent).
* Indicates the estimate or proportion has a relative standard error between 25 per cent and 50 per cent and should therefore be used with caution.
np Not published. – Nil or rounded to zero.
Performance indicator data for Aboriginal and Torres Strait Islander people in this chapter are available in the attachment tables listed below. Contextual data and further supporting information can be found in the chapter.
| Table number | Table title |
|---|---|
| Table 14A.18 | Representation of Aboriginal and Torres Strait Islander Australians in the aged care target population and aged care recipients |
| Table 14A.32 | Hospital patient days used by those eligible and waiting for residential aged care |