Report on Government Services 2019
Part F, Chapter 17
17 Youth justice services
This chapter reports on the performance of governments in providing youth justice services.
Download the chapter
- Chapter 17 Youth justice services and attachment tables (PDF - 2209 Kb)
- Chapter 17 Youth justice services (Word - 193 Kb)
- Chapter 17 Attachment tables (XLSX - 678 Kb)
- Key Facts
- Indicator Framework
- Indicator Results
- Indigenous Data
The average daily number of young people aged 10–17 years under youth justice supervision in Australia during 2017-18 was 4765. The majority of these young people were supervised on community-based orders (which include supervised bail, probation and parole) — nationally, on an average day in 2017-18, 82.7 per cent of young people aged 10–17 years who were supervised by youth justice services were in the community, with the remainder in detention.
Aboriginal and Torres Strait Islander young people were significantly overrepresented in youth justice detention. Nationally during 2017-18, the average daily detention rate for Aboriginal and Torres Strait Islander people aged 10–17 years was 35.2 per 10 000 Aboriginal and Torres Strait Islander young people, 24 times the rate for non-Indigenous young people (1.5 per 10 000).
Total recurrent expenditure on detention-based supervision, community-based supervision and group conferencing was $842.4 million across Australia in 2017-18, with detention based supervision accounting for the majority of this expenditure (60.4 per cent, or $509.1 million).
Youth justice services aim to promote community safety, rehabilitate and reintegrate young people who offend, and contribute to a reduction in youth re offending.
To achieve these aims, governments seek to provide youth justice services that:
- divert young people who offend from further progression into the youth justice system to alternative services
- assist young people who offend to address their offending behaviour
- provide a safe and secure environment for the protection of young people during their time in detention
- assist young people who are in youth justice detention to return to the community
- promote the importance of the families and communities of young people who offend, particularly Aboriginal and Torres Strait Islander communities, in the provision of services and programs
- support young people to understand the impact of their offending on others, including victims and the wider community
- recognise the rights of victims.
Governments aim for youth justice services to meet these objectives in an equitable and efficient manner.
The performance indicator framework provides information on equity, efficiency and effectiveness, and distinguishes the outputs and outcomes of youth justice services. The performance indicator framework shows which data are complete and comparable in the 2019 Report.
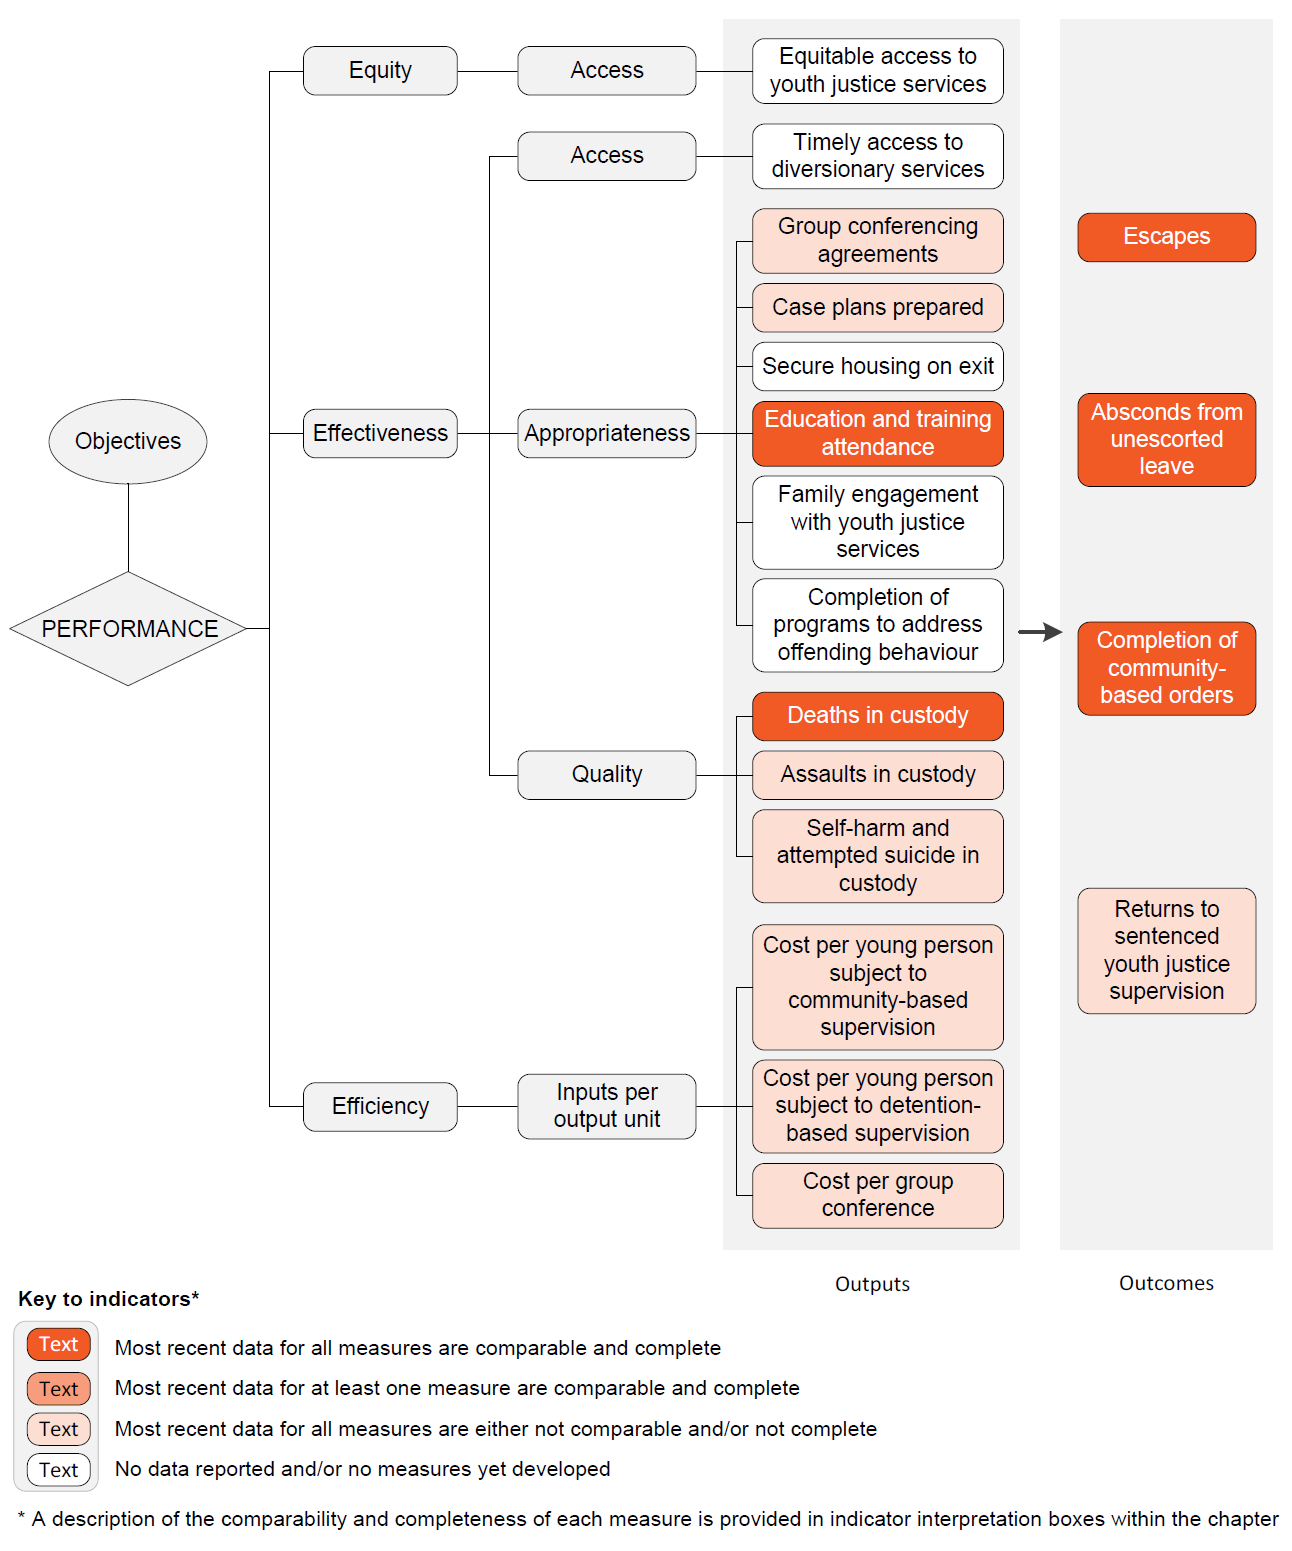
An overview of the Youth justice services performance indicator results are presented. Information to assist the interpretation of these data can be found in the indicator interpretation boxes in the Youth justice services chapter and attachment tables.
Effectiveness — Appropriateness indicators
Group conferencing agreements
Proportion of group conferences resulting in an agreement, 2017‑18
| NSW | Vic | Qld | WA | SA | Tas | ACT | NT | Aust | |
|---|---|---|---|---|---|---|---|---|---|
| % | 99.1 | 100.0 | 97.8 | 86.9 | 91.3 | 95.2 | 98.1 | 100.0 | 93.5 |
Case plans prepared
Proportion of case plans prepared or reviewed within 6 weeks of commencing a sentenced order, 2017‑18 (per cent)
| NSW | Vic | Qld | WA | SA | Tas | ACT | NT | Aust | |
|---|---|---|---|---|---|---|---|---|---|
| Detention order | 100.0 | 89.0 | 75.9 | 100.0 | 87.8 | 100.0 | 90.5 | na | 94.6 |
| Community-based order | 95.7 | 89.0 | 78.4 | na | 72.4 | 46.7 | 87.1 | na | 85.2 |
Education and training attendance
Proportion of young people in detention of compulsory school age attending an education course, 2017‑18
| NSW | Vic | Qld | WA | SA | Tas | ACT | NT | Aust | |
|---|---|---|---|---|---|---|---|---|---|
| % | 100.0 | 100.0 | 100.0 | 73.0 | 100.0 | 100.0 | 100.0 | na | 93.8 |
Effectiveness — Quality indicators
Deaths in custody
Number of young people who died in custody, 2017‑18
| NSW | Vic | Qld | WA | SA | Tas | ACT | NT | Aust | |
|---|---|---|---|---|---|---|---|---|---|
| no. | – | – | – | – | – | – | – | – | – |
Assaults in custody
Rate of young people injured as a result of a serious assault per 10 000 custody nights, 2017‑18
| NSW | Vic | Qld | WA | SA | Tas | ACT | NT | Aust | |
|---|---|---|---|---|---|---|---|---|---|
| Rate | 0.1 | 0.1 | 0.1 | 0.7 | – | – | – | – | .. |
Source: Attachment tables 17A.16 and 17A.18
Rate of young people injured as a result of an assault per 10 000 custody nights, 2017‑18
| NSW | Vic | Qld | WA | SA | Tas | ACT | NT | Aust | |
|---|---|---|---|---|---|---|---|---|---|
| Rate | 5.7 | 3.9 | 5.0 | 5.9 | 8.0 | 45.8 | – | 10.5 | .. |
Source: Attachment tables 17A.16 and 17A.17
Self‑harm and attempted suicide in custody
Rate of incidents of self‑harm or attempted suicide in custody requiring hospitalisation per 10 000 custody nights, 2017‑18
| NSW | Vic | Qld | WA | SA | Tas | ACT | NT | Aust | |
|---|---|---|---|---|---|---|---|---|---|
| Rate | 1.6 | – | – | na | – | – | – | 0.7 | .. |
Source: Attachment table 17A.19
Rate of incidents of self‑harm or attempted suicide in custody that did not require hospitalisation per 10 000 custody nights, 2017‑18
| NSW | Vic | Qld | WA | SA | Tas | ACT | NT | Aust | |
|---|---|---|---|---|---|---|---|---|---|
| Rate | 6.8 | 6.2 | 1.2 | na | 3.7 | 12.0 | 3.7 | 11.9 | .. |
Efficiency — Inputs per output unit indicators
Cost per young person subject to community-based supervision
Average cost per day per young person subject to community-based supervision, 2017-18
| NSW | Vic | Qld | WA | SA | Tas | ACT | NT | Aust | |
|---|---|---|---|---|---|---|---|---|---|
| $ | 146.01 | 181.32 | 190.59 | 93.21 | 124.79 | 137.56 | 101.14 | 526.42 | 163.93 |
Cost per young person subject to detention-based supervision
Average cost per day per young person subject to detention-based supervision, 2017-18
| NSW | Vic | Qld | WA | SA | Tas | ACT | NT | Aust | |
|---|---|---|---|---|---|---|---|---|---|
| $ | 1282 | 1695 | 1305 | 1016 | 2084 | 3070 | 3320 | 2038 | 1455 |
Cost per group conference
Cost per concluded group conference, 2017-18
| NSW | Vic | Qld | WA | SA | Tas | ACT | NT | Aust | |
|---|---|---|---|---|---|---|---|---|---|
| $ | 904 | 10 901 | 8 055 | 9 843 | 1 068 | 688 | 10 811 | 12 541 | 6 682 |
Outcome indicators
Escapes
Rates of escapes from detention and escorted movement, 2017‑18
| NSW | Vic | Qld | WA | SA | Tas | ACT | NT | Aust | |
|---|---|---|---|---|---|---|---|---|---|
| Detention (rate per 10 000 custody nights) | 0.2 | – | – | – | – | – | – | 0.7 | 0.1 |
| Escorted movements (rate per 10 000 escorted movements) | 7.5 | – | – | – | – | – | – | 37.3 | 7.0 |
Source: Attachment table 17A.23
Absconds from unescorted leave
Rate of absconds per 1000 periods of unescorted leave, 2017‑18
| NSW | Vic | Qld | WA | SA | Tas | ACT | NT | Aust | |
|---|---|---|---|---|---|---|---|---|---|
| Rate | – | – | .. | .. | – | – | – | – | – |
Completion of community-based orders
Proportion of community‑based orders successfully completed, 2017‑18
| NSW | Vic | Qld | WA | SA | Tas | ACT | NT | Aust | |
|---|---|---|---|---|---|---|---|---|---|
| % | 81.6 | 91.1 | 81.2 | 64.7 | 73.1 | 76.6 | 80.3 | 68.5 | 80.0 |
Returns to sentenced youth justice supervision
Proportion of young people who returned to sentenced youth justice supervision within 12 months, 2015-16
| NSW | Vic | Qld | WA | SA | Tas | ACT | NT | Aust | |
|---|---|---|---|---|---|---|---|---|---|
| % | 45.8 | 46.8 | 54.0 | 56.9 | 51.1 | 53.9 | 13.3 | na | 51.3 |
Notes
These data and caveats for these data are available in chapter 17 and attachment 17A.
na Not available. .. Not applicable. – Nil or rounded to zero.
Performance indicator data for Aboriginal and Torres Strait Islander people in this chapter are available in the attachment tables listed below. Contextual data and further supporting information can be found in the chapter.
| Table number | Table title |
|---|---|
| Table 17A.11 | Proportion of group conferences resulting in an agreement, by Indigenous status |
| Table 17A.12 | Case plans prepared/reviewed within 6 weeks of commencing a sentenced order, by Indigenous status |
| Table 17A.13 | Proportion of young people in detention attending education and training, by Indigenous status |
| Table 17A.15 | Deaths in custody, by Indigenous status |
| Table 17A.16 | Serious assaults in custody, by Indigenous status |
| Table 17A.17 | Assaults in custody, by Indigenous status |
| Table 17A.19 | Self-harm and attempted suicide in custody, by Indigenous status |
| Table 17A.23 | Escapes from detention and escorted movement, by Indigenous status |
| Table 17A.24 | Absconds from unescorted leave, by Indigenous status |
| Table 17A.25 | Completion of community-based orders, by Indigenous status |