Report on Government Services 2023
PART E: RELEASED ON 2 FEBRUARY 2023
E Health
Data downloads
These data tables relate to the sector as a whole. Data specific to individual service areas are in the data tables under the relevant service area.
- Health data tables (XLSX - 441 Kb)
- Health dataset (CSV - 1068 Kb)
See the Sector overview text and corresponding table number in the data tables for detailed definitions, caveats, footnotes and data source(s).
Note: Data tables are referenced by table xA.1, xA.2, etc, with x referring to the section or overview. For example, table EA.1 refers to data table 1 for this sector overview.
Main aims of services within the sector
The main objective of the health sector is that Australians are born and remain healthy. To this end, health sector services seek to promote, restore and maintain a healthy society through the delivery of services that prevent illness, promote health, detect and treat illness and injury, rehabilitate and provide palliative care.
Services included in the sector
- Primary and community health
Includes general practice, pharmaceutical services, dentistry, allied health services, maternal and child health, alcohol and drug treatment and other services. - Ambulance services
Includes responding to and treating out-of-hospital medical emergencies. - Public hospitals
Includes care provided to admitted and non-admitted patients, including acute and non-acute care and mental health services. - Services for mental health
Includes MBS-subsidised mental health services provided by primary and community health providers, State and Territory government specialised mental health services and non-government services providing community-based support.
Other major areas of government involvement in health provision not covered in the health sections, or elsewhere in the Report, include public health programs (other than those for mental health) and funding for specialist medical practitioners (although data on patient out-of-pocket costs for specialist services are provided as contextual information in the Primary and community health section).
Detailed information on the equity, effectiveness and efficiency of service provision and the achievement of outcomes for primary and community health, ambulance, public hospital and services for mental health are contained in service-specific sections.
Government expenditure in the sector
Total government recurrent expenditure for health services for the latest years covered in this Report was $132.3 billion. Public hospitals was the largest contributor ($81.6 billion in 2020-21, table 12A.1), followed by primary and community health ($45.8 billion in 2020-21, table 10A.1) and ambulance services ($4.9 billion in 2021-22, table 11A.11). Expenditure on services for mental health was $10.9 billion in 2020-21 (table 13A.1); however, as much of this expenditure is already captured in public hospital and primary and community health expenditure, it is not included in the health sector expenditure total to avoid double counting. For the 2020-21 financial year (the most recent financial year for which data are available across all sections) this represented 42.1 per cent of total government expenditure covered in this Report.
When expenditure by local government and for health services outside the scope of this Report are added, government expenditure in 2020-21 was estimated at $156.0 billion.1
Flows in the sector
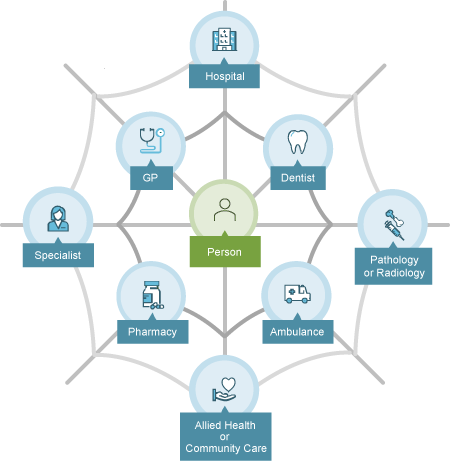
Health services in Australia are delivered by a variety of government and non‑government providers in a range of service settings that do not have a clearly defined path (figure E.1). Primary and community health services are the most common entry points to the health system in Australia. Ambulance services and public hospital emergency departments can also be first points of contact. Some patients may then progress through the system to become non-admitted or admitted hospital patients (including specialist mental health care) or medical specialist patients. Patients might cycle through various points in the health system for treatment of a particular condition. Finally, some patients will require rehabilitation provided by hospitals or primary and community health services.
Figure E.1 Client flow within the Australian health care system
Nationally in 2021, nurses and midwives made up the largest group of FTE health workers (327 176), followed by allied health practitioners (160 016) and medical practitioners (111 232). This trend was also evident for Aboriginal and Torres Strait Islander health care workers, where nurses and midwives were the largest workforce group (4736). Medical practitioners had the highest proportion of the workforce aged 60 years or older (15.5 per cent), while allied health practitioners had the highest proportion aged under 30 years (26.6 per cent) (EA.43–47).
Sector-wide indicators
This overview reports on four sector-wide indicators of governments’ objective that Australians are born and remain healthy:
- babies born of low birthweight
- selected potentially preventable diseases
- life expectancy
- mortality rates.
Data on key risk factors affecting outcomes for these indicators (including overweight/obesity, smoking and risky alcohol consumption) are available in tables EA.3, EA.7 and EA.9.
Babies born of low birthweight
In 2020, 5.0 per cent of babies born in Australia were of low birthweight (table EA.1). The proportion of babies born of low birthweight to Aboriginal and Torres Strait Islander mothers was more than twice that for babies born to non-Indigenous mothers (table EA.2; figure E.2). Data on the Aboriginal and Torres Strait Islander status of the baby are available in table EA.1.
Selected potentially preventable diseases
Selected potentially preventable diseases are diseases that could potentially have been prevented through the provision of health interventions and early disease management. Diseases covered in this Report include selected cancers, heart attacks and type 2 diabetes.
Nationally in 2019, the age standardised rate of new cases of selected cancers was highest for female breast cancer (126.6 per 100 000 females), followed by melanoma, bowel cancer, and lung cancer (54.1, 52.1 and 42.8 per 100 000 population respectively) and lowest for cervical cancer (7.3 per 100 000 females) (table EA.11). More recent data for 2020 are available for two jurisdictions (Victoria and SA) in table EA.11.
Nationally in 2020, the age standardised rate of heart attacks (acute coronary events) was 276.9 cases per 100 000 people (table EA.14). The national rate has decreased each year over the 10 years included in this Report. The rate for females is less than half the rate for males.
Nationally in 2011-12 (the only year of data available), an estimated 4.3 per cent of adults had type 2 diabetes, with rates higher for males compared with females (table EA.23).
Life expectancy
The average life expectancy at birth in the period 1901–1910 was 55.2 years for males and 58.8 years for females.2 It has risen steadily each decade since, reaching 81.3 years for males and 85.4 years for females in 2019–2021 (table EA.29). The life expectancy of Aboriginal and Torres Strait Islander people is considerably lower than that of other people, with a life expectancy at birth of (71.6 years for Aboriginal and Torres Strait Islander males and 75.6 years for Aboriginal and Torres Strait Islander females born 2015–2017). For the same reference period, the life expectancy at birth for non‑Indigenous males was 80.2 years and for non‑Indigenous females was 83.4 years (table EA.30 (headline estimates)).
Mortality rates
The national age standardised mortality rate, measured in deaths per 100 000 people, was 501.9 in 2021 — an increase from 2020 (table EA.31; figure E.3). In line with life expectancy data, mortality rates are higher for Aboriginal and Torres Strait Islander people compared to non-Indigenous people (table EA.32).
Perinatal and children
Mortality data are separately reported for children for perinatal deaths (fetal deaths [still births] and neonatal deaths [death of an infant within 28 days of birth]), infant deaths (children aged 0<1 year) and infant and child deaths (children aged 0<5 years).
There were 8.1 perinatal deaths per 1000 births (table EA.41) in 2021, of which around 70 per cent were fetal deaths and the remainder neonatal deaths (tables EA.39–41).
In 2021, the average infant mortality rate was 3.3 deaths per 1000 live births (table EA.33). Over the past 10 years, the average infant mortality rate has ranged from 3.1 deaths per 1000 live births (2016 and 2018) to 3.6 deaths per 1000 live births (2013). The Australian infant and child combined mortality rate (3-year average) has decreased over time from 91.5 deaths per 100 000 population in 2010-12 to 74.4 deaths per 100 000 population in 2019-21 (table EA.35).
Causes and prevention
The most common causes of death among all Australians in 2021 were cancers and diseases of the circulatory system (including heart disease, heart attack and stroke), though rates for both have reduced significantly from 2012 (table EA.37). Data by Indigenous status is available in table EA.38.
There is potential to prevent some deaths through individualised care and/or to treat health conditions through existing primary or hospital care. Nationally, there were 95.9 potentially avoidable deaths per 100 000 people in 2021 — the lowest rate across the 10 years of data included in this Report (table EA.26). The rate of potentially avoidable deaths in 2017–2021 for Aboriginal and Torres Strait Islander people (310.6 per 100 000 people) was more than three times the rate for other Australians (96.9), but similar to the total population was the lowest rate across the 10 years of data included in this Report (table EA.27).
Footnotes
- AIHW Health Expenditure Database; Australian Bureau of Statistics, Taxation revenue, Australia, 2020–21 (AIHW customised report). Locate Footnote 1 above
- Australian Bureau of Statistics (ABS) 2010, Deaths Australia 2009, https://www.abs.gov.au/ausstats/abs@.nsf/Products/16B1031FC87A6A8CCA2577D600109F8A?opendocument. Locate Footnote 2 above
Impact of COVID-19 on data for the Health sector
COVID-19 may affect data in this Report in a number of ways. This includes in respect of actual performance (that is, the impact of COVID-19 on service delivery from 2020 to 2022 which is reflected in the data results), and the collection and processing of data (that is, the ability of data providers to undertake data collection and process results for inclusion in the Report).
Pandemic plans and social distancing restrictions introduced in 2020 and 2021 are likely to have had an impact on the Health sector. Any impacts which are specific to the service areas covered in this Report are noted in sections 10, 11, 12 and 13.