There were 1 111 532 children aged 12 years or younger attending Australian Government Child Care Benefit approved child care services in the March quarter 2014. This represents an increase of 7.6 per cent from 2013.
In 2013, 272 810 children, or 90.9 per cent of 4 year old children were enrolled in a preschool program in the year before full time schooling. This represents an increase from 86.2 per cent in 2012.
In 2013, 73.9 per cent of 4 year old Aboriginal and Torres Strait Islander children were enrolled in a preschool program in the year before full time schooling. This proportion has increased from 65.0 per cent in 2012.
The median weekly cost for 50 hours of Australian Government Child Care Benefit approved long day care increased by 4.9 per cent from 2013 to 2014 and by 9.7 per cent for family day care.
At 30 June 2014, 62.3 per cent of National Quality Framework approved services with a quality rating were rated overall as meeting or exceeding the National Quality Standard.
Total Australian, State and Territory government expenditure on early childhood education and care was $7.7 billion in 2013-14 — a real increase of $857.8 million (12.5 per cent) from 2012-13.
Early childhood education and care services aim to:
- meet the education and care needs of all children in developmentally appropriate ways, in a safe and nurturing environment
- provide quality services across a range of settings delivered in an equitable and efficient manner, meeting individual need.
The performance indicator framework provides information on equity, efficiency and effectiveness, and distinguishes the outputs and outcomes of ECEC services. The performance indicator framework shows which data are complete and comparable in the 2015 Report.
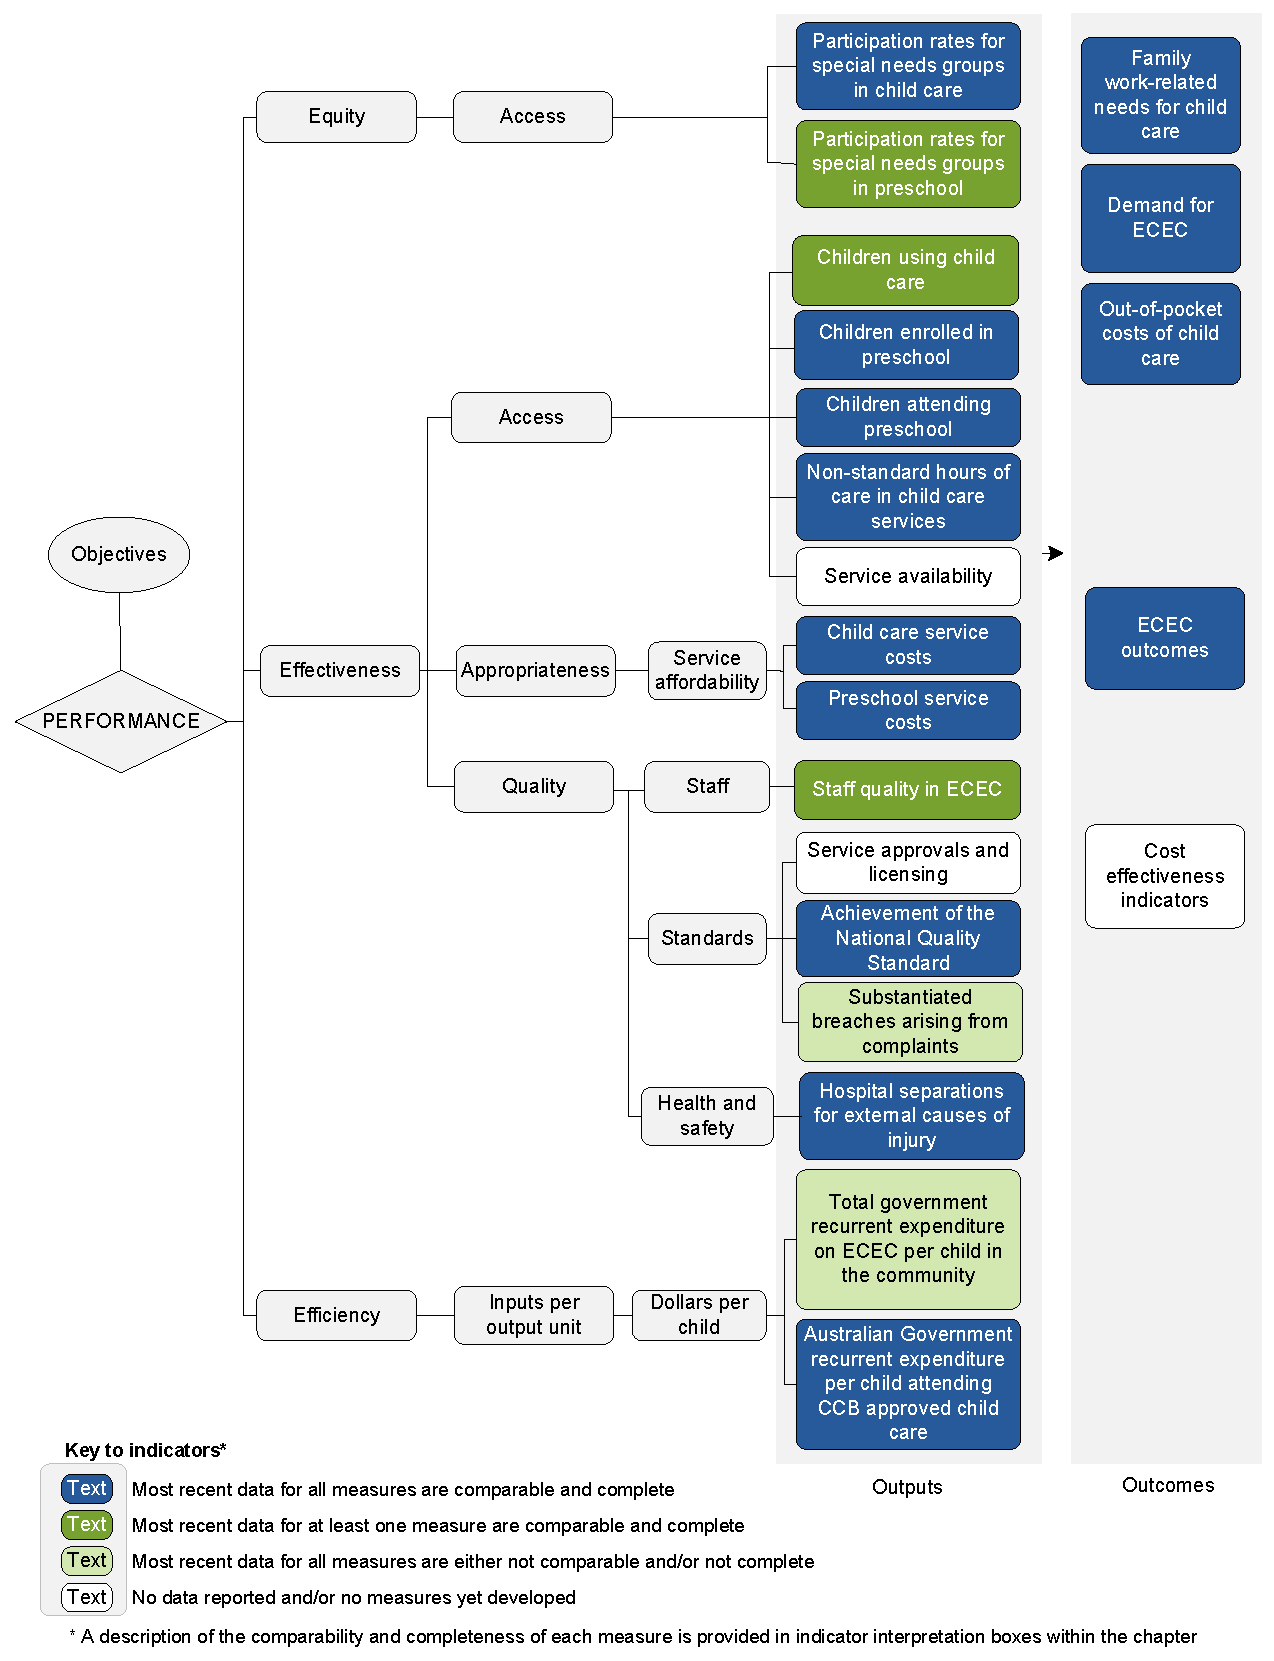
An overview of the Early childhood education and care (ECEC) performance indicator results are presented. Information to assist the interpretation of these data can be found in the indicator interpretation boxes in the ECEC chapter and attachment tables.
Expand allCollapse all
Equity — Access indicators
Participation rates for special needs groups in child care
Proportion of 0-12 year olds attending Child Care Benefit (CCB) approved child care who are from non-English speaking backgrounds, 2013. Compared to community proportion, 2011.Most recent data for this measure are comparable and complete (chapter 3).
| |
NSW |
Vic |
Qld |
WA |
SA |
Tas |
ACT |
NT |
Aust |
| % |
21.3 |
24.8 |
9.0 |
13.4 |
10.4 |
3.5 |
16.0 |
10.6 |
17.3 |
| % |
23.7 |
23.4 |
13.2 |
18.0 |
15.7 |
7.3 |
19.2 |
40.0 |
20.0 |
Source: Attachment table 3A.13.
Proportion of 0-12 year olds attending CCB approved child care who are Aboriginal and Torres Strait Islander children, 2014. Compared to community proportion, 2013.Most recent data for this measure are comparable and complete (chapter 3).
| |
NSW |
Vic |
Qld |
WA |
SA |
Tas |
ACT |
NT |
Aust |
| % |
2.6 |
0.8 |
3.8 |
2.5 |
1.6 |
5.3 |
1.2 |
9.7 |
2.4 |
| % |
5.4 |
1.6 |
7.9 |
6.4 |
4.5 |
9.3 |
2.8 |
41.6 |
5.6 |
Source: Attachment table 3A.13.
Proportion of 0-12 year olds attending CCB approved child care who are from low income families, 2014. Compared to community proportion, 2011-12.Most recent data for this measure are comparable and complete (chapter 3).
| |
NSW |
Vic |
Qld |
WA |
SA |
Tas |
ACT |
NT |
Aust |
| % |
13.4 |
11.8 |
13.5 |
11.1 |
12.4 |
14.3 |
4.7 |
8.3 |
12.6 |
| % |
22.5 |
20.4 |
21.4 |
13.8 |
21.9 |
26.9 |
7.8 |
22.5 |
20.7 |
Source: Attachment table 3A.13.
Proportion of 0-12 year olds attending CCB approved child care with disability, 2013. Compared to community proportion, 2012.Most recent data for this measure are comparable and complete (chapter 3).
| |
NSW |
Vic |
Qld |
WA |
SA |
Tas |
ACT |
NT |
Aust |
| % |
3.8 |
2.5 |
2.4 |
2.1 |
4.2 |
2.4 |
2.8 |
4.7 |
3.0 |
| % |
6.8 |
6.3 |
6.4 |
7.4 |
6.7 |
9.3 |
7.0 |
4.0 |
6.7 |
Source: Attachment table 3A.13.
Participation rates for special needs groups in preschool
Proportion of 3-5 year olds enrolled in a preschool program who are Aboriginal and Torres Strait Islander children, 2013. Compared to community proportion, 2013.Most recent data for this measure are comparable and complete (chapter 3).
| |
NSW |
Vic |
Qld |
WA |
SA |
Tas |
ACT |
NT |
Aust |
| % |
4.5 |
1.3 |
5.2 |
6.6 |
7.6 |
8.3 |
2.8 |
39.7 |
4.7 |
| % |
5.3 |
1.7 |
8.0 |
6.3 |
4.6 |
9.8 |
2.7 |
40.0 |
5.6 |
Source: Attachment table 3A.14.
Proportion of 3-5 year olds enrolled in a preschool program who are from regional areas, 2013. Compared to community proportion, 2013.Most recent data for this measure are comparable and complete (chapter 3).
| |
NSW |
Vic |
Qld |
WA |
SA |
Tas |
ACT |
NT |
Aust |
| % |
29.9 |
23.7 |
33.2 |
17.8 |
23.5 |
98.5 |
3.0 |
50.7 |
28.5 |
| % |
25.1 |
23.9 |
35.7 |
17.3 |
23.9 |
98.2 |
0.2 |
50.3 |
27.6 |
Source: Attachment table 3A.14.
Proportion of 3-5 year olds enrolled in a preschool program who are from remote areas, 2013. Compared to community proportion, 2013.Most recent data for this measure are comparable and complete (chapter 3).
| |
NSW |
Vic |
Qld |
WA |
SA |
Tas |
ACT |
NT |
Aust |
| % |
0.8 |
–
|
3.0 |
7.5 |
4.2 |
1.5 |
.. |
47.2 |
2.5 |
| % |
0.6 |
0.1 |
3.7 |
7.2 |
3.9 |
1.8 |
.. |
49.7 |
2.7 |
Legend: .. Not applicable; – Nil or rounded to zero
Source: Attachment table 3A.14.
Effectiveness — Access indicators
Children using child care
Proportion of children aged 0-12 years using CCB approved child care, 2014.Most recent data for this measure are comparable and complete (chapter 3).
| |
NSW |
Vic |
Qld |
WA |
SA |
Tas |
ACT |
NT |
Aust |
| % |
29.6 |
29.1 |
32.8 |
20.0 |
31.3 |
27.5 |
37.8 |
18.3 |
29.0 |
Source: Attachment table 3A.9.
Children enrolled in preschool
Proportion of 4 year old children who are enrolled in a preschool program in the year before full time schooling, 2013.Most recent data for this measure are comparable and complete (chapter 3).
| |
NSW |
Vic |
Qld |
WA |
SA |
Tas |
ACT |
NT |
Aust |
| % |
72.6 |
105.5 |
97.4 |
99.3 |
83.5 |
103.8 |
108.0 |
92.8 |
90.9 |
Source: Attachment table 3A.16.
Proportion of 4 year old Aboriginal and Torres Strait Islander children who are enrolled in a preschool program in the year before full time schooling, 2013.Most recent data for this measure are comparable and complete (chapter 3).
| |
NSW |
Vic |
Qld |
WA |
SA |
Tas |
ACT |
NT |
Aust |
| % |
60.3 |
83.6 |
64.4 |
99.3 |
99.8 |
88.0 |
93.5 |
87.0 |
73.9 |
Source: Attachment table 3A.19.
Children attending preschool
Proportion of children aged 4 and 5 years who are attending a preschool program in the year before full time schooling, 2013.Most recent data for this measure are comparable and complete (chapter 3).
| |
NSW |
Vic |
Qld |
WA |
SA |
Tas |
ACT |
NT |
Aust |
| % |
71.3 |
101.0 |
95.2 |
99.3 |
82.5 |
101.5 |
106.3 |
81.9 |
88.7 |
Source: Attachment table 3A.21.
Non-standard hours of care in child care services
Proportion of Australian Government CCB approved child care services providing non-standard hours of care, 2014.Most recent data for this measure are comparable and complete (chapter 3).
| |
NSW |
Vic |
Qld |
WA |
SA |
Tas |
ACT |
NT |
Aust |
| % |
14.4 |
19.9 |
47.8 |
21.6 |
21.2 |
10.3 |
3.0 |
12.6 |
23.6 |
Source: Attachment table 3A.28.
Effectiveness — Appropriateness — Service affordability
Child care service costs
Median weekly cost for 50 hours of CCB approved long day care (LDC) and family day care (FDC), 2014.Most recent data for this measure are comparable and complete (chapter 3).
| |
NSW |
Vic |
Qld |
WA |
SA |
Tas |
ACT |
NT |
Aust |
| $ LDC |
416 |
400 |
346 |
383 |
364 |
374 |
463 |
368 |
385 |
| $ FDC |
360 |
395 |
351 |
363 |
388 |
384 |
398 |
411 |
375 |
Source: Attachment table 3A.30.
Preschool service costs
Median per hour preschool program cost per child, after subsidies received by families, 2013.Most recent data for this measure are comparable and complete (chapter 3).
| |
NSW |
Vic |
Qld |
WA |
SA |
Tas |
ACT |
NT |
Aust |
| $ |
3.20 |
2.10 |
2.20 |
– |
– |
– |
– |
– |
2.10 |
Legend: – Nil or rounded to zero
Source: Attachment table 3A.33.
Effectiveness — Quality — Staff indicators
Staff quality in ECEC
Proportion of paid primary contact staff employed by CCB approved child care services with a relevant formal qualification at or above Certificate level III, 2013.Most recent data for this measure are comparable and complete (chapter 3).
| |
NSW |
Vic |
Qld |
WA |
SA |
Tas |
ACT |
NT |
Aust |
| % |
73.5 |
79.8 |
76.5 |
68.9 |
70.1 |
75.4 |
50.6 |
53.2 |
74.1 |
Source: Attachment table 3A.36.
Effectiveness — Quality — Standards indicators
Achievement of the National Quality Standard (NQS)
Of National Quality Framework (NQF) approved services with a quality rating, what proportion have an overall rating of Meeting NQS or Exceeding NQS, 30 June 2014.Most recent data for this measure are comparable and complete (chapter 3).
| |
NSW |
Vic |
Qld |
WA |
SA |
Tas |
ACT |
NT |
Aust |
| % |
53.3 |
77.5 |
70.6 |
44.8 |
65.8 |
38.6 |
40.1 |
18.4 |
62.3 |
Source: Attachment table 3A.41.
Efficiency — Inputs per output unit — Dollars per child indicators
Total government recurrent expenditure on ECEC per child in the community
Australian Government and State and Territory government recurrent expenditure on ECEC per child aged 0-12 years in the community, 2013-14.Most recent data for this measure are comparable and complete (chapter 3).
| |
NSW |
Vic |
Qld |
WA |
SA |
Tas |
ACT |
NT |
Aust |
| $ |
1850 |
1951 |
2043 |
1799 |
2325 |
2106 |
2569 |
2695 |
1969 |
Source: Attachment tables 3A.50, 3A.51.
Australian Government recurrent expenditure per child attending CCB approved child care
Australian Government recurrent expenditure per child aged 0-12 years attending CCB approved child care, 2014.Most recent data for this measure are comparable and complete (chapter 3).
| |
NSW |
Vic |
Qld |
WA |
SA |
Tas |
ACT |
NT |
Aust |
| $ |
5605 |
5561 |
5454 |
5525 |
5529 |
5607 |
5318 |
8442 |
5589 |
Source: Attachment table 3A.52.
Outcome indicators
Family work-related needs for child care
Proportion of children aged 0-12 years in families for whom additional formal child care was currently required for work-related reasons, 2011.Most recent data for this measure are comparable and complete (chapter 3).
| |
NSW |
Vic |
Qld |
WA |
SA |
Tas |
ACT |
NT |
Aust |
| % |
2.3 ±0.6 |
3.0 ±1.0 |
2.7 ±1.4 |
2.7 ±1.0 |
3.1 ±1.4 |
3.0 ±1.7 |
4.1 ±2.9 |
np |
2.7 ±0.4 |
Legend: np Not published
Source: Attachment table 3A.53.
Demand for ECEC
Proportion of children aged 0-12 years for whom additional formal child care or preschool services were currently required.Most recent data for this measure are comparable and complete (chapter 3).
| |
NSW |
Vic |
Qld |
WA |
SA |
Tas |
ACT |
NT |
Aust |
| % |
5.4 ±0.9 |
5.9 ±1.6 |
5.6 ±1.6 |
5.6 ±1.4 |
4.5 ±1.5 |
5.6 ±2.3 |
6.4 ±3.3 |
4.2 ±2.5 |
5.5 ±0.5 |
Source: Attachment table 3A.54.
Out-of-pocket costs of child care
Proportion of weekly disposable income that families with $75 000 gross disposable income spend on one child in full time long day care, after the payment of child care subsidies, 2014.Most recent data for this measure are comparable and complete (chapter 3).
| |
NSW |
Vic |
Qld |
WA |
SA |
Tas |
ACT |
NT |
Aust |
| % |
10.6 |
10.4 |
7.8 |
10.1 |
8.8 |
9.0 |
15.3 |
9.4 |
9.7 |
Source: Attachment table 3A.56.
ECEC outcomes
Proportion of children who have had ECEC experience that are developmentally vulnerable on one or more domains of the Australian Early Development Census, 2011.Data for this indicator are comparable, subject to caveats (chapter 3).
| |
NSW |
Vic |
Qld |
WA |
SA |
Tas |
ACT |
NT |
Aust |
| % |
17.7 |
17.9 |
22.8 |
21.8 |
22.2 |
21.1 |
21.3 |
34.0 |
19.8 |
Source: Attachment table 3A.58.
Some results reported here include 95 per cent confidence intervals (for example, 80 per cent ± 2.7 per cent).