Report on Government Services 2015
Chapter 5, Volume B
Vocational education and training
The Vocational education and training (VET) chapter (chapter 5) of the Report on Government Services reports on government funded VET services delivered by government and private Registered Training Organisations.
It includes training activity funded under the National Agreement for Skills and Workforce Development (NASWD). The scope of this chapter does not extend to VET services provided in schools (which are within the scope of School education, chapter 4) or university education.
Download the chapter
- Chapter 5 Vocational education and training, attachment tables, and data quality information (PDF - 4311 Kb)
- Chapter 5 Attachment tables (XLSX - 1048 Kb)
- Key Facts
- Indicator Framework
- Indicator Results
In 2013, the Australian and State and Territory governments provided $5.8 billion of recurrent expenditure for vocational education and training (VET).
Nationally in 2013, 1.5 million people participated in government funded training. The national participation rate in government funded training for 15-64 year olds was 8.4 per cent. (These figures do not include all students undertaking accredited training. For example, many students undertake training not funded by government).
In 2013, government funded students participated in 460.1 million hours of VET delivered by technical and further education (TAFE) institutes, other government providers, universities, community organisations and private providers, at 25 027 locations.
The Student Outcomes Survey identified that nationally in 2013, 83.0 per cent of all government funded VET graduates indicated that the course helped or partly helped them achieve their main reason for doing the course.
Nationally in 2012, 587 755 VET qualifications were completed by both government and non-government funded VET students, and 77.6 per cent of qualifications completed by students aged 15-64 years in 2012 were at the certificate III level or above.
The objective for the VET system, as outlined in the NASWD, is a system that delivers a productive and highly skilled workforce and which enables all working age Australians to develop the skills and qualifications needed to participate effectively in the labour market and contribute to Australia's economic future; and supports the achievement of increased rates of workforce participation.
Success in meeting the objective for the VET system is underpinned in the NASWD by the following target outcomes:
- the skill levels of the working age population are increased to meet the changing needs of the economy
- all working age Australians have the opportunity to develop skills
- training delivers the skills and capabilities needed for improved economic participation for working age Australians.
The performance indicator framework provides information on equity, efficiency and effectiveness, and distinguishes the outputs and outcomes of VET services. The performance indicator framework shows which data are complete and comparable in the 2015 Report.
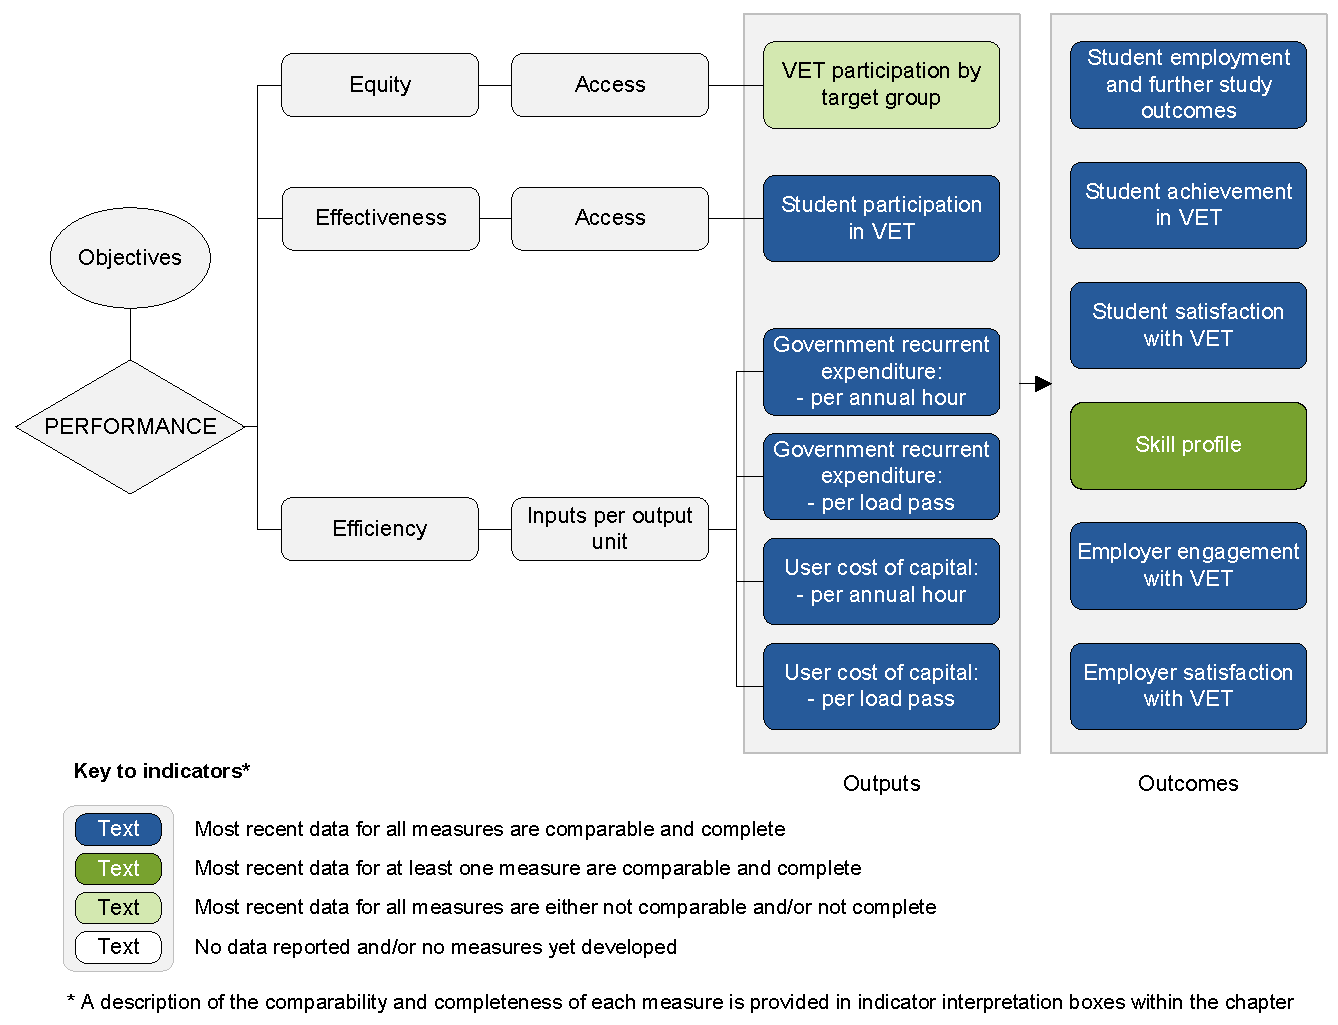
An overview of the VET performance indicator results are presented. Information to assist the interpretation of these data can be found in the indicator interpretation boxes in the VET chapter and attachment tables.
Equity — Access indicators
VET participation by target group
Data for this indicator are not directly comparable (chapter 5).
| NSW | Vic | Qld | WA | SA | Tas | ACT | NT | Aust | |
|---|---|---|---|---|---|---|---|---|---|
| % | 21.5 | 22.4 | 10.2 | 20.2 | 20.8 | 9.5 | 19.4 | 18.3 | 17.4 |
Effectiveness indicators
Participation in government funded VET
Data for this indicator are not directly comparable (chapter 5).
| NSW | Vic | Qld | WA | SA | Tas | ACT | NT | Aust | |
|---|---|---|---|---|---|---|---|---|---|
| % | 8.4 | 12.6 | 6.4 | 8.1 | 13.4 | 9.0 | 8.0 | 11.6 | 9.4 |
Efficiency indicators
Government recurrent expenditure
Data for this indicator are comparable, subject to caveats (chapter 5).
| NSW | Vic | Qld | WA | SA | Tas | ACT | NT | Aust | |
|---|---|---|---|---|---|---|---|---|---|
| $ | 14.07 | 9.36 | 17.40 | 14.87 | 11.09 | 16.71 | 17.28 | 23.85 | 12.60 |
| NSW | Vic | Qld | WA | SA | Tas | ACT | NT | Aust | |
|---|---|---|---|---|---|---|---|---|---|
| $ | 17.98 | 11.13 | 20.10 | 18.74 | 12.42 | 21.33 | 20.28 | 30.26 | 15.23 |
User cost of capital
Data for this indicator are comparable, subject to caveats (chapter 5).
| NSW | Vic | Qld | WA | SA | Tas | ACT | NT | Aust | |
|---|---|---|---|---|---|---|---|---|---|
| $ | 2.96 | 1.25 | 2.48 | 2.15 | 1.69 | 3.05 | 2.81 | 3.73 | 2.05 |
| NSW | Vic | Qld | WA | SA | Tas | ACT | NT | Aust | |
|---|---|---|---|---|---|---|---|---|---|
| $ | 3.79 | 1.49 | 2.87 | 2.72 | 1.89 | 3.90 | 3.30 | 4.73 | 2.48 |
Outcome indicators
Student employment and further study outcomes
Data for this indicator are comparable, subject to caveats (chapter 5).
| NSW | Vic | Qld | WA | SA | Tas | ACT | NT | Aust | |
|---|---|---|---|---|---|---|---|---|---|
| % | 86.7 ±0.8 | 86.5 ±1.6 | 87.9 ±1.1 | 90.0 ±0.8 | 89.6 ±1.1 | 87.9 ±1.7 | 91.2 ±1.6 | 91.8 ±2.0 | 87.5 ±0.6 |
| NSW | Vic | Qld | WA | SA | Tas | ACT | NT | Aust | |
|---|---|---|---|---|---|---|---|---|---|
| % | 58.6 ±1.2 | 57.7 ±2.2 | 64.7 ±1.5 | 64.8 ±1.3 | 60.6 ±1.8 | 61.4 ±2.5 | 65.0 ±2.9 | 67.0 ±3.3 | 60.3 ±0.9 |
Student achievement in VET
Data for this indicator are comparable, subject to caveats (chapter 5).
| NSW | Vic | Qld | WA | SA | Tas | ACT | NT | Aust | |
|---|---|---|---|---|---|---|---|---|---|
| % | 78.6 | 83.3 | 89.4 | 81.6 | 87.1 | 80.1 | 84.7 | 79.3 | 82.9 |
| NSW | Vic | Qld | WA | SA | Tas | ACT | NT | Aust | |
|---|---|---|---|---|---|---|---|---|---|
| % | 14.9 | 22.3 | 17.8 | 15.4 | 13.8 | 14.4 | 15.8 | 14.0 | 18.0 |
Student satisfaction with VET
Data for this indicator are comparable, subject to caveats (chapter 5).
| NSW | Vic | Qld | WA | SA | Tas | ACT | NT | Aust | |
|---|---|---|---|---|---|---|---|---|---|
| % | 88.7 ±0.8 | 85.4 ±1.6 | 87.8 ±1.1 | 89.1 ±0.9 | 88.4 ±1.2 | 89.2 ±1.5 | 85.7 ±2.1 | 88.3 ±2.3 | 87.5 ±0.6 |
Skill profile
This indicator has multiple measures and data comparability and completeness vary (chapter 5).
| NSW | Vic | Qld | WA | SA | Tas | ACT | NT | Aust | |
|---|---|---|---|---|---|---|---|---|---|
| % | 8.2 | 32.6 | -6.8 | – | 22.9 | 6.0 | 14.7 | -3.1 | 12.7 |
Source: Attachment table 5A.79.
| NSW | Vic | Qld | WA | SA | Tas | ACT | NT | Aust | |
|---|---|---|---|---|---|---|---|---|---|
| % | -8.8 | -4.7 | -12.0 | -2.0 | 30.1 | -15.1 | -12.0 | -6.4 | -4.4 |
Employer engagement with VET
Data for this indicator are comparable, subject to caveats (chapter 5).
| NSW | Vic | Qld | WA | SA | Tas | ACT | NT | Aust | |
|---|---|---|---|---|---|---|---|---|---|
| % | 35.8 ±3.1 | 29.8 ±3.4 | 32.5 ±3.5 | 36.3 ±3.9 | 30.9 ±3.9 | 33.7 ±4.4 | 30.8 ±4.0 | 38.6 ±4.0 | 33.3 ±1.6 |
Employer satisfaction with VET
Data for this indicator are comparable, subject to caveats (chapter 5).
| NSW | Vic | Qld | WA | SA | Tas | ACT | NT | Aust | |
|---|---|---|---|---|---|---|---|---|---|
| % | 79.2 ±4.7 | 80.2 ±5.8 | 74.2 ±5.4 | 78.2 ±6.0 | 79.8 ±6.0 | 79.5 ±6.2 | 77.8 ±7.5 | 71.9 ±6.5 | 78.3 ±2.5 |
Some results reported here include 95 per cent confidence intervals (for example, 80 per cent ± 2.7 per cent).