Report on Government Services 2015
Chapter 6, Volume C
Police services
The Police services chapter (chapter 6) of the Report on Government Services reports on the operations of the police agencies of each State and Territory government, including the ACT community policing function performed by the Australian Federal Police.
Download the chapter
- Chapter 6 Police services, attachment tables, and data quality information (PDF - 1893 Kb)
- Chapter 6 Attachment tables (XLSX - 504 Kb)
- Key Facts
- Indicator Framework
- Indicator Results
Recurrent expenditure on community policing services across Australia was approximately $10.2 billion (or $437 per person) in 2013-14. Police agencies employed 69 462 staff in 2013-14.
Information is included on community safety, crime, road safety and judicial services. For example, data are reported on public perceptions of safety and public perceptions of particular crimes as a problem, recorded victims of crime and perceptions of safety and crime, road safety as well as lower court defendants resulting in a guilty plea or finding.
The objectives of police services are to:
- allow people to undertake their lawful pursuits confidently and safely
- bring to justice those people responsible for committing an offence
- promote safer behaviour on roads
- support the judicial process to achieve efficient and effective court case management and judicial processing, providing safe custody for alleged offenders, and ensuring fair and equitable treatment of both victims and alleged offenders.
The performance indicator framework provides information on equity, efficiency and effectiveness, and distinguishes the outputs and outcomes of police services. The performance indicator framework shows which data are complete and comparable in the 2015 Report.
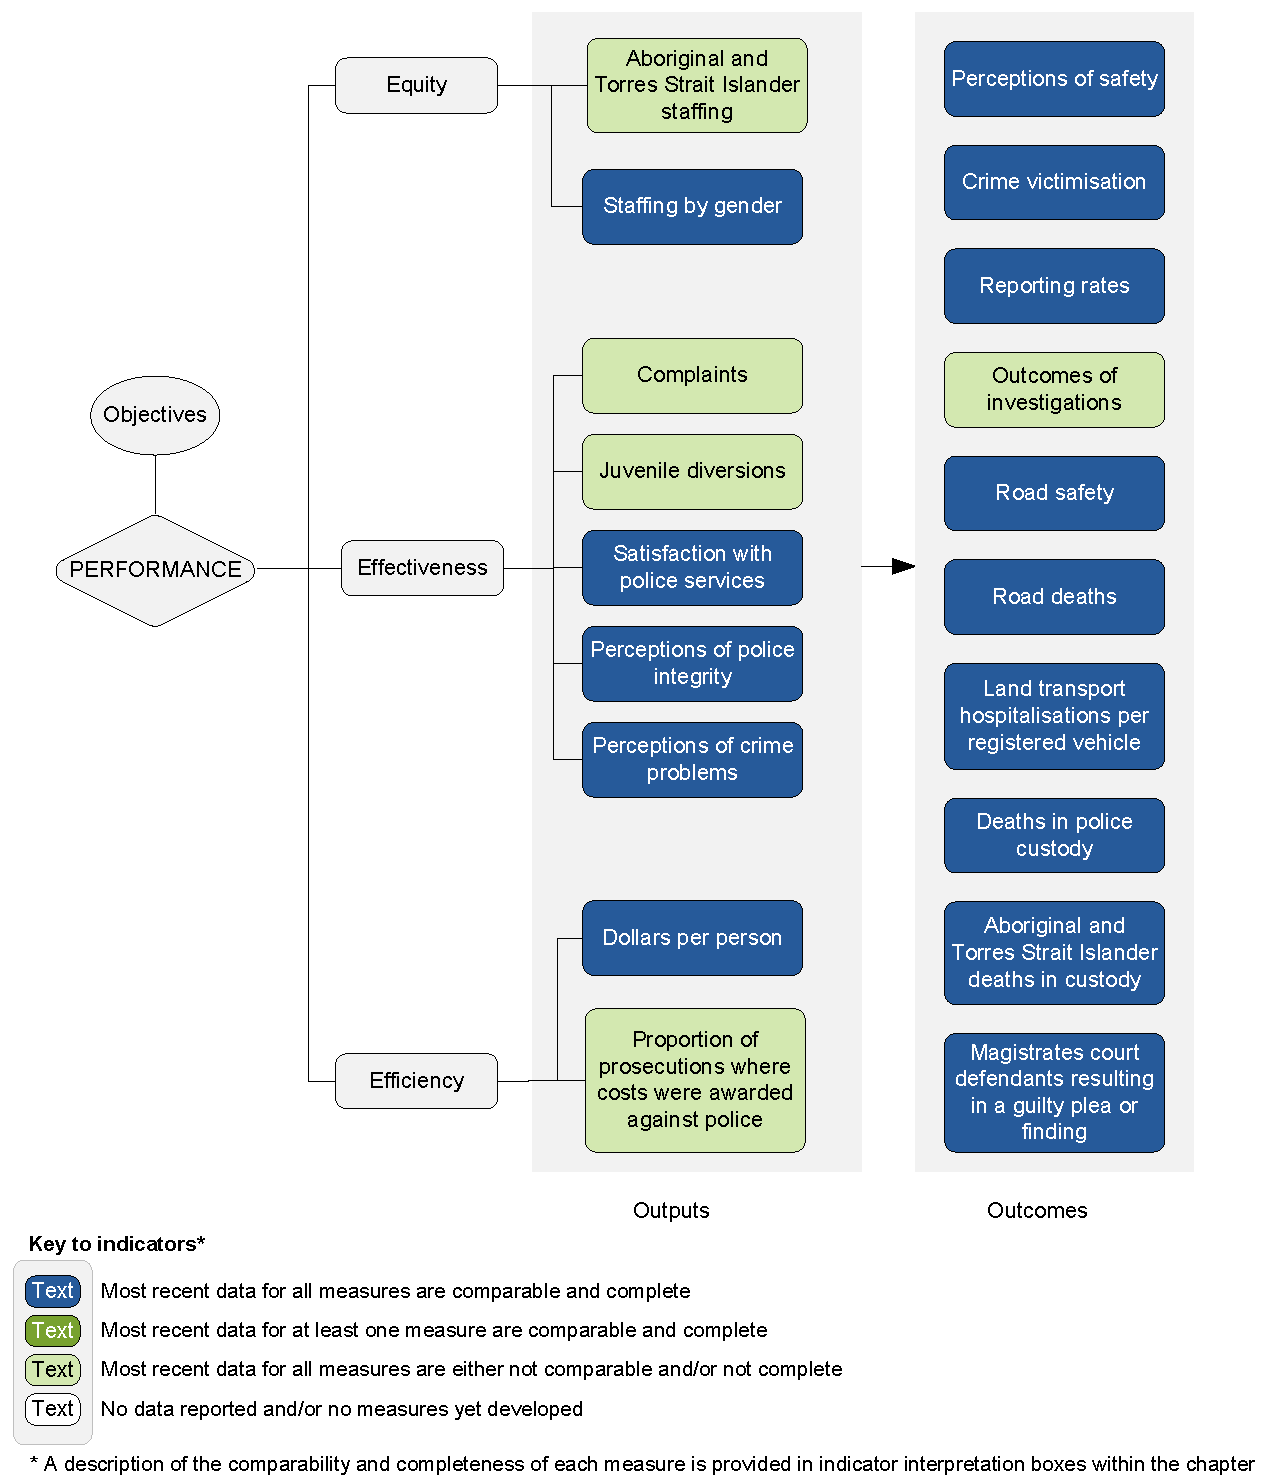
An overview of the Police services performance indicator results are presented. Information to assist the interpretation of these data can be found in the indicator interpretation boxes in the Police services chapter and attachment tables.
Equity — Access indicators
Aboriginal and Torres Strait Islander staffing
Data for this indicator not complete or not directly comparable (chapter 6).
| NSW | Vic | Qld | WA | SA | Tas | ACT | NT | Aust | |
|---|---|---|---|---|---|---|---|---|---|
| % | 2.4 | 0.3 | 2.3 | 1.5 | 1.1 | 1.7 | 1.3 | 6.6 | .. |
Source: Attachment table 6A.17.
Staffing by gender
Data for this indicator comparable, subject to caveats (chapter 6).
| NSW | Vic | Qld | WA | SA | Tas | ACT | NT | Aust | |
|---|---|---|---|---|---|---|---|---|---|
| % | 32.7 | 30.1 | 34.8 | 29.5 | 30.7 | 35.8 | 33.7 | 36.2 | .. |
Source: Attachment table 6A.18.
Effectiveness — Output indicators
Complaints
Data for this indicator not complete or not directly comparable (chapter 6).
| NSW | Vic | Qld | WA | SA | Tas | ACT | NT | Aust | |
|---|---|---|---|---|---|---|---|---|---|
| No. | 45 | 16 | 28 | 43 | 81 | 21 | 48 | 118 | .. |
Source: Attachment table 6A.16.
Juvenile diversions
Data for this indicator not complete or not directly comparable (chapter 6).
| NSW | Vic | Qld | WA | SA | Tas | ACT | NT | Aust | |
|---|---|---|---|---|---|---|---|---|---|
| % | na | 17 | 35 | 45 | 53 | 58 | 40 | 39 | .. |
Source: Attachment table 6A.39.
Satisfaction with police services
Data for this indicator comparable, subject to caveats (chapter 6).
| NSW | Vic | Qld | WA | SA | Tas | ACT | NT | Aust | |
|---|---|---|---|---|---|---|---|---|---|
| % | 73.4 | 76.9 | 76.0 | 70.7 | 82.2 | 77.0 | 77.9 | 75.4 | 75.3 |
Perceptions of police integrity
Data for this indicator comparable, subject to caveats (chapter 6).
| NSW | Vic | Qld | WA | SA | Tas | ACT | NT | Aust | |
|---|---|---|---|---|---|---|---|---|---|
| Fair and treat people equally (%) | 75.5 | 75.1 | 76.7 | 76.2 | 77.8 | 81.0 | 79.9 | 74.3 | 76.1 |
| Professional (%) | 85.9 | 87.3 | 87.0 | 85.1 | 89.6 | 89.0 | 89.7 | 86.2 | 86.7 |
| Honest (%) | 72.9 | 74.5 | 74.3 | 73.5 | 78.8 | 79.5 | 79.2 | 76.7 | 74.4 |
Perceptions of crime problems
Data for this indicator comparable, subject to caveats (chapter 6).
| NSW | Vic | Qld | WA | SA | Tas | ACT | NT | Aust | |
|---|---|---|---|---|---|---|---|---|---|
| Illegal drugs (%) | 39.9 | 38.5 | 30.9 | 38.8 | 32.5 | 32.6 | 28.3 | 37.6 | 36.7 |
| Speeding cars, dangerous or noisy driving (%) | 59.2 | 61.5 | 58.7 | 68.6 | 61.0 | 58.1 | 63.9 | 57.2 | 60.9 |
Efficiency indicators
Dollars per person
Data for this indicator comparable, subject to caveats (Chapter 6).
| NSW | Vic | Qld | WA | SA | Tas | ACT | NT | Aust | |
|---|---|---|---|---|---|---|---|---|---|
| $ | 443 | 394 | 418 | 496 | 415 | 399 | 440 | 1227 | 437 |
Proportion of prosecutions where costs were awarded against police
Data for this indicator not complete or not directly comparable (Chapter 6).
| NSW | Vic | Qld | WA | SA | Tas | ACT | NT | Aust | |
|---|---|---|---|---|---|---|---|---|---|
| % | 0.20 | 0.14 | 0.01 | 1.16 | 1.76 | – | 1.06 | 0.92 | .. |
Source: Attachment table 6A.41.
Effectiveness — Outcome indicators
Perceptions of safety
Data for this indicator comparable, subject to caveats (Chapter 6).
| NSW | Vic | Qld | WA | SA | Tas | ACT | NT | Aust | |
|---|---|---|---|---|---|---|---|---|---|
| % | 87.5 | 90.4 | 89.7 | 86.0 | 90.4 | 92.9 | 93.8 | 85.9 | 89.0 |
| NSW | Vic | Qld | WA | SA | Tas | ACT | NT | Aust | |
|---|---|---|---|---|---|---|---|---|---|
| % | 53.0 | 50.2 | 49.5 | 47.6 | 48.6 | 58.9 | 54.4 | 43.7 | 50.8 |
| NSW | Vic | Qld | WA | SA | Tas | ACT | NT | Aust | |
|---|---|---|---|---|---|---|---|---|---|
| % | 26.3 | 23.5 | 25.4 | 17.3 | 25.5 | 22.2 | 32.5 | 13.9 | 24.3 |
Crime victimisation
Data for this indicator comparable, subject to caveats (Chapter 6).
| NSW | Vic | Qld | WA | SA | Tas | ACT | NT | Aust | |
|---|---|---|---|---|---|---|---|---|---|
| Physical assault | 2250 | 2636 | 3106 | 3489 | 2590 | 2586 | 2608 | 4542 | 2706 |
| Threatened assault | 2433 | 2599 | 2840 | 3361 | 3406 | 3670 | 3420 | 3974 | 2781 |
| Robbery | 303 | 390 | 282 | 623 | 200 | 468 | 610 | 426 | 357 |
| Sexual assault | 247 | 237 | 209 | 311 | 86 | 288 | 177 | 455 | 233 |
| Break in | 2440 | 2334 | 2709 | 4374 | 2130 | 2367 | 2843 | 7948 | 2699 |
| Attempted break-in | 1629 | 1585 | 1965 | 3466 | 1660 | 1989 | 2427 | 3613 | 1926 |
| Vehicle theft | 701 | 534 | 611 | 929 | 382 | 805 | 347 | 1445 | 644 |
| Theft from vehicle | 2429 | 3366 | 2356 | 6232 | 3055 | 2225 | 2497 | 3613 | 3110 |
| Malicious damage | 6022 | 6500 | 4547 | 9208 | 6301 | 6676 | 7212 | 8671 | 6260 |
| Other theft | 2383 | 3033 | 2989 | 3247 | 2600 | 3078 | 2497 | 3324 | 2802 |
Reporting rates
Data for this indicator comparable, subject to caveats (Chapter 6).
| NSW | Vic | Qld | WA | SA | Tas | ACT | NT | Aust | |
|---|---|---|---|---|---|---|---|---|---|
| Physical assault | 48.0 | 42.0 | 59.5 | 44.4 | 63.3 | 52.9 | 40.8 | 48.2 | 49.7 |
| Threatened assault | 35.4 | 39.3 | 38.5 | 37.2 | 32.8 | 45.1 | 27.3 | 51.1 | 37.2 |
| Robbery | 49.1 | 39.8 | 67.6 | 51.2 | 39.5 | 64.4 | na | na | 49.7 |
| Sexual assault | 53.8 | 34.7 | na | 32.5 | na | 30.1 | na | na | 34.2 |
| Break-in | 78.8 | 77.1 | 77.2 | 78.9 | 77.0 | 84.4 | 72.8 | 73.9 | 77.9 |
| Attempted break-in | 41.7 | 47.4 | 43.0 | 43.4 | 34.8 | 49.2 | 46.0 | 38.4 | 43.2 |
| Vehicle theft | 94.2 | na | 87.7 | na | 100.0 | na | 100.0 | na | 92.7 |
| Theft from vehicle | 56.7 | 59.3 | 45.9 | 57.0 | 45.1 | 45.9 | 59.1 | 55.5 | 54.7 |
| Malicious damage | 49.6 | 47.4 | 50.7 | 58.8 | 46.7 | 48.7 | 46.2 | 60.2 | 50.5 |
| Other theft | 31.6 | 36.8 | 35.5 | 36.8 | 39.4 | 39.1 | 38.2 | 34.8 | 35.4 |
Source: Attachment tables 6A.29-30).
Outcomes of investigations
Data for this indicator not complete or not directly comparable (Chapter 6).
| NSW | Vic | Qld | WA | SA | Tas | ACT | NT | Aust | |
|---|---|---|---|---|---|---|---|---|---|
| Homicide and related offences | 60.8 | 67.9 | 68.1 | 65.2 | 72.5 | 70.0 | np | 87.0 | .. |
| Sexual assault | 29.6 | 36.4 | 51.0 | 38.7 | 42.6 | 44.1 | 33.0 | 66.5 | .. |
| Armed robbery | 31.8 | 37.3 | 49.8 | 38.5 | 38.8 | 56.5 | 19.7 | 43.8 | .. |
| Unarmed robbery | 27.3 | 30.5 | 50.6 | 31.3 | 36.5 | 73.9 | 23.5 | 57.8 | .. |
| Kidnapping | 42.3 | 45.3 | 45.6 | 64.7 | 49.3 | np | np | np | .. |
| Unlawful entry | 7.4 | 8.5 | 15.3 | 10.6 | 8.6 | 17.2 | 3.5 | 29.6 | 10.4 |
| Vehicle theft | 7.7 | 11.3 | 31.2 | 21.2 | 14.4 | 13.9 | 4.1 | 36.5 | 16.4 |
| Other theft | 12.1 | 15.4 | 24.6 | 11.5 | 15.8 | 26.7 | 8.9 | 31.1 | 16.0 |
Source: Attachment tables 6A.31-32.
Road safety
Data for this indicator comparable, subject to caveats (Chapter 6).
| NSW | Vic | Qld | WA | SA | Tas | ACT | NT | Aust | |
|---|---|---|---|---|---|---|---|---|---|
| Without a seatbelt | 4.3 | 6.1 | 5.0 | 4.9 | 6.8 | 6.2 | 4.9 | 8.2 | 5.2 |
| Over alcohol limit | 8.6 | 7.2 | 5.7 | 8.1 | 9.1 | 9.1 | 9.1 | 10.5 | 7.7 |
| Speeding >10km/h | 56.7 | 49.4 | 56.6 | 59.9 | 45.6 | 55.7 | 62.9 | 62.0 | 54.5 |
Road deaths
Data for this indicator comparable, subject to caveats (Chapter 6).
| NSW | Vic | Qld | WA | SA | Tas | ACT | NT | Aust | |
|---|---|---|---|---|---|---|---|---|---|
| Rate | 6.7 | 5.7 | 6.2 | 7.7 | 6.6 | 8.8 | 2.9 | 27.6 | 6.4 |
Land transport hospitalisations per registered vehicle
Data for this indicator comparable, subject to caveats (Chapter 6).
| NSW | Vic | Qld | WA | SA | Tas | ACT | NT | Aust | |
|---|---|---|---|---|---|---|---|---|---|
| Rate | 259 | 189 | 231 | 220 | 228 | 156 | 291 | 428 | 228 |
Deaths in police custody
Data for this indicator comparable, subject to caveats (Chapter 6).
| NSW | Vic | Qld | WA | SA | Tas | ACT | NT | Aust | |
|---|---|---|---|---|---|---|---|---|---|
| No. | 5 | 2 | 4 | 6 | 1 | – | – | – | 18 |
Source: Attachment table 6A.38.
Aboriginal and Torres Strait Islander deaths in custody
Data for this indicator comparable, subject to caveats (Chapter 6).
| NSW | Vic | Qld | WA | SA | Tas | ACT | NT | Aust | |
|---|---|---|---|---|---|---|---|---|---|
| No. | – | – | 1 | 3 | 1 | – | – | – | 5 |
Source: Attachment table 6A.38.
Magistrates court defendants resulting in a guilty plea or finding
Data for this indicator comparable, subject to caveats (Chapter 6).
| NSW | Vic | Qld | WA | SA | Tas | ACT | NT | Aust | |
|---|---|---|---|---|---|---|---|---|---|
| % | 94.6 | 97.2 | 99.3 | 99.3 | 99.4 | 87.9 | 96.3 | 96.6 | 97.4 |