Report on Government Services 2017
Volume B, Chapter 4
School education
This chapter focuses on performance information for government-funded school education in Australia.
Download the chapter
- Chapter 4 School education and attachment tables (PDF - 5060 Kb)
- Chapter 4 Attachment tables (XLSX - 1717 Kb)
- Key Facts
- Indicator Framework
- Indicator Results
- Indigenous Data
Nationally in 2015:
- there were 3.7 million full‑time school students, which represents 15.7 per cent of the Australian population, who were enrolled across 9404 schools
- the majority of students (65.1 per cent of full‑time equivalent students) were enrolled in a government school. The majority of schools were government owned and managed
- Aboriginal and Torres Strait Islander students accounted for 6.9 per cent of students at government schools and 2.4 per cent of students in non-government schools.
Recurrent expenditure by Australian, State and Territory governments on school education in 2014‑15 was $53.0 billion, of which $40.3 billion was spent on government schools.
Improving educational outcomes for all young Australians is central to the nation’s social and economic prosperity and will position young people to live fulfilling, productive and responsible lives. The goals for school education are that: 1) Australian schooling promotes equity and excellence; and 2) all young Australians become successful learners, confident and creative individuals, and active and informed citizens.
Australia’s governments aim to have a school education system:
- that benefits all young Australians, providing them with essential literacy and numeracy skills, a solid foundation in knowledge and understanding linked with complex skills that underpin problem solving, critical thinking and creativity, so they can reach their full potential
- where Australian students excel by international standards
- that reduces the educational disadvantage of children
- that enables young people to make a successful transition from school to work and/or further study.
For these goals to be achieved, the school education system aims to provide all young Australians with access to high-quality schooling that:
- engages all students and promotes student participation, attendance and successful transitions through schooling
- has a focus on quality teaching and world-class curriculum and assessment.
Governments aim for school education services to meet these objectives in an equitable and efficient manner.
The performance indicator framework provides information on equity, efficiency and effectiveness, and distinguishes the outputs and outcomes of school education. The performance indicator framework shows which data are complete and comparable in the 2017 Report.
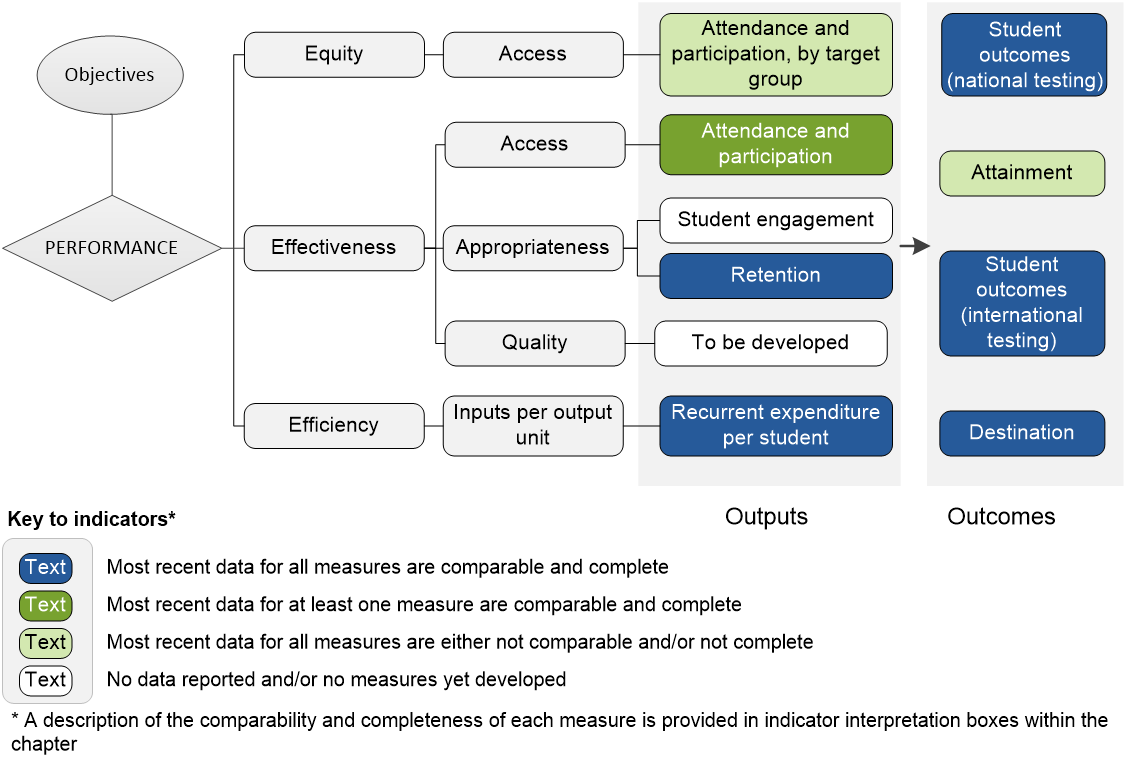
An overview of the School education performance indicator results are presented. Information to assist the interpretation of these data can be found in the indicator interpretation boxes in the School education chapter and attachment tables.
Equity — Access indicators
Attendance by target group
Years 7–10 attendance rate, Aboriginal and Torres Strait Islander students, government schools, 2016
| NSW | Vic | Qld | WA | SA | Tas | ACT | NT | Aust | |
|---|---|---|---|---|---|---|---|---|---|
| % | 80.7 | 83.8 | 81.5 | 67.3 | 76.9 | 81.6 | 79.9 | 61.7 | 77.7 |
Years 7–10 attendance level, Aboriginal and Torres Strait Islander students, government schools, 2016
| NSW | Vic | Qld | WA | SA | Tas | ACT | NT | Aust | |
|---|---|---|---|---|---|---|---|---|---|
| % | na | 49.4 | 45.8 | 26.7 | 36.4 | 49.5 | 38.0 | 19.6 | 38.5 |
Effectiveness — Access indicators
Attendance and participation
Years 7–10 attendance rate, all students, government schools, 2016
| NSW | Vic | Qld | WA | SA | Tas | ACT | NT | Aust | |
|---|---|---|---|---|---|---|---|---|---|
| % | 90.0 | 91.6 | 89.7 | 87.8 | 89.4 | 87.6 | 89.1 | 76.3 | 89.8 |
Years 7–10 attendance level, all students, government schools, 2015
| NSW | Vic | Qld | WA | SA | Tas | ACT | NT | Aust | |
|---|---|---|---|---|---|---|---|---|---|
| % | na | 73.5 | 66.9 | 63.7 | 67.2 | 63.7 | 65.0 | 41.4 | 68.1 |
Participation rate, 15–19 year olds, all schools, 2015
| NSW | Vic | Qld | WA | SA | Tas | ACT | NT | Aust | |
|---|---|---|---|---|---|---|---|---|---|
| % | 56.6 | 61.8 | 50.9 | 52.1 | 63.1 | 62.1 | 70.8 | 45.6 | 57.6 |
Proportion of the population aged 15–19 years who successfully completed at least one Unit of Competency as part of a VET qualification at AQF Certificate II or above, 2015
| NSW | Vic | Qld | WA | SA | Tas | ACT | NT | Aust | |
|---|---|---|---|---|---|---|---|---|---|
| % | 25.3 | 38.0 | 35.1 | 41.6 | 26.2 | 21.8 | 29.9 | 16.8 | 32.3 |
Effectiveness — Appropriateness indicators
Retention
Apparent retention rate, year 7/8‑10, full time secondary students, government schools, 2015
| NSW | Vic | Qld | WA | SA | Tas | ACT | NT | Aust | |
|---|---|---|---|---|---|---|---|---|---|
| % | 103.6 | 107.9 | 103.5 | 101.3 | 105.3 | 101.4 | 108.6 | 83.1 | 104.2 |
Apparent retention rate, year 10‑12, full time secondary students, government schools, 2015
| NSW | Vic | Qld | WA | SA | Tas | ACT | NT | Aust | |
|---|---|---|---|---|---|---|---|---|---|
| % | 72.6 | 81.2 | 82.1 | 79.0 | 91.1 | 73.8 | 111.3 | 62.5 | 79.2 |
Efficiency — Inputs per output unit indicators
Recurrent expenditure per student
Government expenditure per FTE student, government schools, 2014‑15 – Includes user cost of capital
| NSW | Vic | Qld | WA | SA | Tas | ACT | NT | Aust | |
|---|---|---|---|---|---|---|---|---|---|
| $ | 16 956 | 14 612 | 16 198 | 19 745 | 16 616 | 17 188 | 20 532 | 24 394 | 16 670 |
Government expenditure per FTE student, non‑government schools, 2014‑15
| NSW | Vic | Qld | WA | SA | Tas | ACT | NT | Aust | |
|---|---|---|---|---|---|---|---|---|---|
| $ | 9 790 | 9 251 | 10 223 | 10 555 | 9 377 | 10 555 | 8 623 | 17 373 | 9 843 |
Government recurrent expenditure on staff per FTE student in government schools, 2014‑15
| NSW | Vic | Qld | WA | SA | Tas | ACT | NT | Aust | |
|---|---|---|---|---|---|---|---|---|---|
| $ | 10 799 | 9 220 | 10 549 | 11 819 | 11 343 | 11 550 | 12 753 | 13 921 | 10 607 |
Outcome indicators
Student outcomes (national testing)
NAPLAN Participation — Participation rate in NAPLAN reading assessment, 2016
| NSW | Vic | Qld | WA | SA | Tas | ACT | NT | Aust | |
|---|---|---|---|---|---|---|---|---|---|
| All students — Year 3 | 97.0 | 94.6 | 93.2 | 95.3 | 93.3 | 94.5 | 93.1 | 89.8 | 95.0 |
| All students — Year 9 | 93.5 | 90.6 | 87.2 | 93.7 | 89.5 | 90.5 | 90.9 | 80.6 | 91.2 |
| Aboriginal and Torres Strait Islander students — Year 3 | 94.8 | 87.8 | 87.7 | 84.2 | 84.7 | 93.0 | 84.5 | 80.4 | 88.9 |
| Aboriginal and Torres Strait Islander students — Year 9 | 80.8 | 73.5 | 75.2 | 68.2 | 70.6 | 82.9 | 78.4 | 62.5 | 74.9 |
NAPLAN Reading — proportion of students achieving at or above national minimum standard, 2016
| NSW | Vic | Qld | WA | SA | Tas | ACT | NT | Aust | |
|---|---|---|---|---|---|---|---|---|---|
| All students — Year 3 | 95.8 ± 0.3 | 95.8 ± 0.4 | 95.4 ± 0.4 | 93.8 ± 0.6 | 93.4 ± 0.8 | 94.0 ± 1.0 | 96.3 ± 0.9 | 73.8 ± 5.7 | 95.1 ± 0.2 |
| All students — Year 9 | 93.1 ± 0.5 | 93.4 ± 0.7 | 92.4 ± 0.8 | 94.0 ± 0.9 | 91.9 ± 1.5 | 92.7 ± 1.6 | 95.2 ± 1.8 | 68.3 ± 9.5 | 92.8 ± 0.3 |
| Aboriginal and Torres Strait Islander students — Year 3 | 87.6 ± 1.2 | 87.3 ± 2.4 | 85.2 ± 1.9 | 71.3 ± 3.1 | 74.7 ± 4.5 | 91.1 ± 2.9 | 84.2 ± 10.5 | 42.2 ± 6.7 | 80.6 ± 1.3 |
| Aboriginal and Torres Strait Islander students — Year 9 | 80.2 ± 1.6 | 81.6 ± 3.3 | 75.9 ± 3.0 | 69.4 ± 3.8 | 74.4 ± 4.2 | 86.4 ± 4.5 | 81.4 ± 8.4 | 34.2 ± 8.1 | 73.6 ± 1.7 |
NAPLAN Numeracy — proportion of students achieving at or above national minimum standard, 2016
| NSW | Vic | Qld | WA | SA | Tas | ACT | NT | Aust | |
|---|---|---|---|---|---|---|---|---|---|
| All students — Year 3 | 95.9 ± 0.3 | 95.9 ± 0.4 | 96.0 ± 0.4 | 95.0 ± 0.5 | 94.2 ± 0.7 | 95.8 ± 0.9 | 96.9 ± 0.8 | 77.9 ± 5.4 | 95.5 ± 0.2 |
| All students — Year 9 | 95.4 ± 0.4 | 95.4 ± 0.6 | 95.3 ± 0.6 | 95.9 ± 0.7 | 94.4 ± 1.4 | 95.7 ± 1.1 | 96.4 ± 1.6 | 75.2 ± 8.4 | 95.2 ± 0.3 |
| Aboriginal and Torres Strait Islander students — Year 3 | 88.4 ± 1.2 | 87.7 ± 2.4 | 85.7 ± 2.0 | 76.2 ± 2.9 | 78.0 ± 4.1 | 94.0 ± 2.3 | 87.6 ± 6.8 | 50.0 ± 7.2 | 82.6 ± 1.2 |
| Aboriginal and Torres Strait Islander students — Year 9 | 84.4 ± 1.7 | 84.6 ± 3.0 | 83.4 ± 2.7 | 77.6 ± 3.4 | 80.1 ± 4.2 | 91.1 ± 3.5 | 84.3 ± 9.5 | 46.1 ± 8.3 | 79.7 ± 1.6 |
Attainment
Year 12 certificate attainment rate, all students, 2015
| NSW | Vic | Qld | WA | SA | Tas | ACT | NT | Aust | |
|---|---|---|---|---|---|---|---|---|---|
| % | 72 | 82 | 71 | 74 | 86 | 51 | 87 | 43 | 75 |
Student outcomes (international testing)
Programme for International Student Assessment (PISA) — proportion of Australian 15 year old students who achieved at or above the national proficient standard, 2015 (%)
| NSW | Vic | Qld | WA | SA | Tas | ACT | NT | Aust | |
|---|---|---|---|---|---|---|---|---|---|
| Reading literacy | 59.5 ± 2.5 | 63.0 ± 3.3 | 59.7 ± 3.1 | 62.8 ± 3.3 | 60.5 ± 3.7 | 48.5 ± 4.1 | 65.1 ± 4.5 | 48.2 ± 7.3 | 60.6 ± 1.4 |
| Mathematical literacy | 54.8 ± 2.8 | 57.7 ± 3.4 | 52.8 ± 3.5 | 60.0 ± 4.1 | 53.5 ± 4.3 | 44.4 ± 4.3 | 61.3 ± 4.2 | 47.4 ± 6.8 | 55.4 ± 1.6 |
| Scientific literacy | 59.2 ± 2.3 | 62.8 ± 2.8 | 59.6 ± 2.9 | 65.5 ± 3.0 | 60.4 ± 3.9 | 48.3 ± 3.5 | 67.9 ± 3.6 | 50.8 ± 5.4 | 60.8 ± 1.2 |
Source: Attachment tables 4A.97, 4A.99 and 4A.101
Trends in International Mathematics and Science Study (TIMSS) — proportion of students who achieved at or above the intermediate standard, 2015 (%)
| NSW | Vic | Qld | WA | SA | Tas | ACT | NT | Aust | |
|---|---|---|---|---|---|---|---|---|---|
| Mathematical achievement — Year 4 | 69.9 ± 5.9 | 74.1 ± 4.3 | 68.8 ± 5.6 | 66.8 ± 7.0 | 69.5 ± 8.0 | 68.0 ±10.2 | 82.3 ± 6.8 | 48.7 ±13.8 | 70.2 ± 2.6 |
| Mathematical achievement — Year 8 | 62.7 ± 6.8 | 69.8 ± 4.1 | 62.3 ± 6.1 | 64.6 ± 5.3 | 61.9 ± 6.9 | 60.6 ± 7.3 | 69.9 ± 4.2 | 39.7 ± 10.2 | 64.4 ± 3.1 |
| Scientific achievement — Year 4 | 75.1 ± 5.5 | 77.7 ± 4.6 | 75.6 ± 4.9 | 70.0 ± 7.2 | 76.8 ± 7.2 | 75.7 ± 9.5 | 84.7 ± 5.6 | 57.8 ± 14.4 | 75.4 ± 2.7 |
| Scientific achievement — Year 8 | 68.4 ± 6.1 | 71.2 ± 3.2 | 67.3 ± 5.6 | 70.3 ± 4.9 | 66.9 ± 6.5 | 65.6 ± 7.9 | 75.8 ± 4.5 | 46.7 ± 12.4 | 68.8 ± 2.6 |
Destination
Proportion of 15–24 year old school leavers who left school at any time fully participating in education and/or training, or employment, 2015
| NSW | Vic | Qld | WA | SA | Tas | ACT | NT | Aust | |
|---|---|---|---|---|---|---|---|---|---|
| % | 72.7 ± 2.3 | 74.5 ± 3.0 | 69.4 ± 3.6 | 76.4 ± 3.8 | 69.7 ± 5.5 | 60.9 ± 9.3 | 76.2 ± 6.3 | 72.2 ± 8.5 | 72.7 ± 1.3 |
Notes
AQF = Australian Qualifications Framework. FTE = Full time equivalent. NAPLAN = National Assessment Program - Literacy and Numeracy.
These data and caveats for these data are available in chapter 4 and attachment 4A.
Some percentages reported in these tables include 95 per cent confidence intervals (for example, 80 per cent ± 2.7 per cent).
na Not available.
Performance indicator data for Aboriginal and Torres Strait Islander people in this chapter are available in the attachment tables listed below. Contextual data and further supporting information can be found in the chapter.
| Table number | Table title |
|---|---|
| Participation and attendance | |
| Table 4A.33 | Student attendance rates, by year level and Indigenous status, 2016 (per cent) |
| Table 4A.34 | Student attendance rates, by year level and Indigenous status, 2015 (per cent) |
| Table 4A.35 | Student attendance rates, government schools, by Indigenous status and remoteness (per cent) |
| Table 4A.36 | Student attendance rates, non-government schools, by Indigenous status and remoteness (per cent) |
| Table 4A.37 | Student attendance rates, all schools, by Indigenous status and remoteness (per cent) |
| Table 4A.38 | Student attendance level, by school level and Indigenous status and remoteness, 2016 (per cent) |
| Table 4A.39 | Student attendance level, by school level and Indigenous status and remoteness, 2015 (per cent) |
| Table 4A.40 | Student attendance level, government schools, by Indigenous status and remoteness (per cent) |
| Table 4A.41 | Student attendance level, non-government schools, by Indigenous status and remoteness (per cent) |
| Retention | |
| Table 4A.42 | Apparent retention rates of full time secondary students from year 7/8, 2015 (per cent) |
| Table 4A.44 | Apparent retention rates of full time secondary students, all schools (per cent) |
| Table 4A.45 | Apparent retention rates of full time secondary students, government schools (per cent) |
| Table 4A.46 | Apparent retention rates of full time secondary students, non‑–‑government schools (per cent) |
| NAPLAN participation | |
| Table 4A.47 | Participation rate in NAPLAN assessment, by Indigenous status, 2016 (per cent) |
| NAPLAN reading | |
| Table 4A.48 | NAPLAN reading: Proportion of students who achieved at or above the national minimum standard, by Indigenous status and geolocation, 2016 (per cent) |
| Table 4A.49 | NAPLAN reading: Mean scores, by Indigenous status and geolocation, 2016 (score points) |
| Table 4A.52 | NAPLAN reading, NSW: Proportion of students who achieved at or above the national minimum standard and Mean scale scores, 2008, 2015 and 2016 |
| Table 4A.53 | NAPLAN reading, Victoria: Proportion of students who achieved at or above the national minimum standard and Mean scale scores, 2008, 2015 and 2016 |
| Table 4A.54 | NAPLAN reading, Queensland: Proportion of students who achieved at or above the national minimum standard and Mean scale scores, 2008, 2015 and 2016 |
| Table 4A.55 | NAPLAN reading, WA: Proportion of students who achieved at or above the national minimum standard and Mean scale scores, 2008, 2015 and 2016 |
| Table 4A.56 | NAPLAN reading, SA: Proportion of students who achieved at or above the national minimum standard and Mean scale scores, 2008, 2015 and 2016 |
| Table 4A.57 | NAPLAN reading, Tasmania: Proportion of students who achieved at or above the national minimum standard and Mean scale scores, 2008, 2015 and 2016 |
| Table 4A.58 | NAPLAN reading, ACT: Proportion of students who achieved at or above the national minimum standard and Mean scale scores, 2008, 2015 and 2016 |
| Table 4A.59 | NAPLAN reading, NT: Proportion of students who achieved at or above the national minimum standard and Mean scale scores, 2008, 2015 and 2016 |
| Table 4A.60 | NAPLAN reading, Australia: Proportion of students who achieved at or above the national minimum standard and Mean scale scores, 2008, 2015 and 2016 |
| NAPLAN Writing | |
| Table 4A.61 | NAPLAN writing: Proportion of students who achieved at or above the national minimum standard, by Indigenous status and geolocation, 2016 (per cent) |
| Table 4A.62 | NAPLAN writing: Mean scores, by Indigenous status and geolocation, 2016 (score points) |
| Table 4A.65 | NAPLAN writing, NSW: Proportion of students who achieved at or above the national minimum standard and Mean scale scores, 2011, 2015 and 2016 |
| Table 4A.66 | NAPLAN writing, Victoria: Proportion of students who achieved at or above the national minimum standard and Mean scale scores, 2011, 2015 and 2016 |
| Table 4A.67 | NAPLAN writing, Queensland: Proportion of students who achieved at or above the national minimum standard and Mean scale scores, 2011, 2015 and 2016 |
| Table 4A.68 | NAPLAN writing, WA: Proportion of students who achieved at or above the national minimum standard and Mean scale scores, 2011, 2015 and 2016 |
| Table 4A.69 | NAPLAN writing, SA: Proportion of students who achieved at or above the national minimum standard and Mean scale scores, 2011, 2015 and 2016 |
| Table 4A.70 | NAPLAN writing, Tasmania: Proportion of students who achieved at or above the national minimum standard and Mean scale scores, 2011, 2015 and 2016 |
| Table 4A.71 | NAPLAN writing, ACT: Proportion of students who achieved at or above the national minimum standard and Mean scale scores, 2011, 2015 and 2016 |
| Table 4A.72 | NAPLAN writing, NT: Proportion of students who achieved at or above the national minimum standard and Mean scale scores, 2011, 2015 and 2016 |
| Table 4A.73 | NAPLAN writing, Australia: Proportion of students who achieved at or above the national minimum standard and Mean scale scores, 2011, 2015 and 2016 |
| NAPLAN Numeracy | |
| Table 4A.74 | NAPLAN numeracy: Proportion of students who achieved at or above the national minimum standard, by Indigenous status and geolocation, 2016 (per cent) |
| Table 4A.75 | NAPLAN numeracy: Mean scores, by Indigenous status and geolocation, 2016 (score points) |
| Table 4A.78 | NAPLAN numeracy, NSW: Proportion of students who achieved at or above the national minimum standard and Mean scale scores, 2008, 2015 and 2016 |
| Table 4A.79 | NAPLAN numeracy, Victoria: Proportion of students who achieved at or above the national minimum standard and Mean scale scores, 2008, 2015 and 2016 |
| Table 4A.80 | NAPLAN numeracy, Queensland: Proportion of students who achieved at or above the national minimum standard and Mean scale scores, 2008, 2015 and 2016 |
| Table 4A.81 | NAPLAN numeracy, WA: Proportion of students who achieved at or above the national minimum standard and Mean scale scores, 2008, 2015 and 2016 |
| Table 4A.82 | NAPLAN numeracy, SA: Proportion of students who achieved at or above the national minimum standard and Mean scale scores, 2008, 2015 and 2016 |
| Table 4A.83 | NAPLAN numeracy, Tasmania: Proportion of students who achieved at or above the national minimum standard and Mean scale scores, 2008, 2015 and 2016 |
| Table 4A.84 | NAPLAN numeracy, ACT: Proportion of students who achieved at or above the national minimum standard and Mean scale scores, 2008, 2015 and 2016 |
| Table 4A.85 | NAPLAN numeracy, NT: Proportion of students who achieved at or above the national minimum standard and Mean scale scores, 2008, 2015 and 2016 |
| Table 4A.86 | NAPLAN numeracy, Australia: Proportion of students who achieved at or above the national minimum standard and Mean scale scores, 2008, 2015 and 2016 |
| NAP Science | |
| Table 4A.89 | National Assessment Program, proportion of Year 6 students at or above proficient standard in science achievement performance, by equity group, Australia |
| NAP Civics | |
| Table 4A.92 | National Assessment Program, proportion of Year 6 students at or above proficient standard in civics and citizenship achievement performance, by equity group, Australia |
| NAP ICT | |
| Table 4A.95 | National Assessment Program, information and communication technologies: proportion of students attaining the proficient standard, by equity group, Australia |