Report on Government Services 2017
Volume B, Chapter 5
Vocational education and training
This chapter reports performance information for government-funded vocational education and training (VET) in Australia.
Please note: An errata was released with this chapter. The files below have been updated to reflect the changes.
Download the chapter
- Chapter 5 Vocational education and training and attachment tables (PDF - 4486 Kb)
- Chapter 5 Attachment tables (XLSX - 1247 Kb)
- Key Facts
- Indicator Framework
- Indicator Results
- Indigenous Data
The Australian, State and Territory governments’ recurrent expenditure (excluding user cost of capital) on VET totalled $5.4 billion in 2015 — in real terms this represents a decrease of 2.1 per cent from 2014, but an overall increase of 8.0 per cent from 2006).
Nationally in 2015:
- around 1.2 million government‑funded VET students were enrolled in 1.6 million courses, with these courses delivered by 1978 RTOs at 35 179 locations. Overall, 7.6 per cent of the Australian population aged 15–64 years participated in government‑funded training
- there were around 479 700 qualifications completed by government‑funded VET students. The majority of qualifications completed were at AQF Certificate level III or IV (63.8 per cent), followed by AQF Certificate level II or lower (23.0 per cent) and AQF Diploma level or above (13.2 per cent)
- 86.8 per cent of all government‑funded VET graduates indicated that they were satisfied with the quality of their completed training.
The VET system, as outlined in the National Agreement for Skills and Workforce Development (NASWD), aims to:
- deliver a productive and highly skilled workforce
- enable all Australians to participate effectively in the labour market and contribute to Australia’s economic future
- contribute to increasing the skill levels of the working aged population.
The NASWD also acknowledges that the VET system has a particular aim to address the needs of individuals experiencing disadvantage or disengagement. To achieve this, the Australian, State and Territory governments aim to create a national training system that:
- is accessible to all working age Australians
- meets the needs of students, by providing them with the opportunity to develop the skills and capabilities needed both for improved economic participation and participation in society
- is accessible to and engages with Australian businesses and industries to develop, harness and use the skills and abilities of the workforce
- meets the needs of employers, by supporting the skill needs of Australian industry and which appropriately responds to areas of future jobs growth
- is centred on quality teaching and learning outcomes.
Governments aim for a national training system that meets these objectives in an equitable and efficient manner.
The performance indicator framework provides information on equity, efficiency and effectiveness, and distinguishes the outputs and outcomes of VET services. The performance indicator framework shows which data are complete and comparable in the 2017 Report.
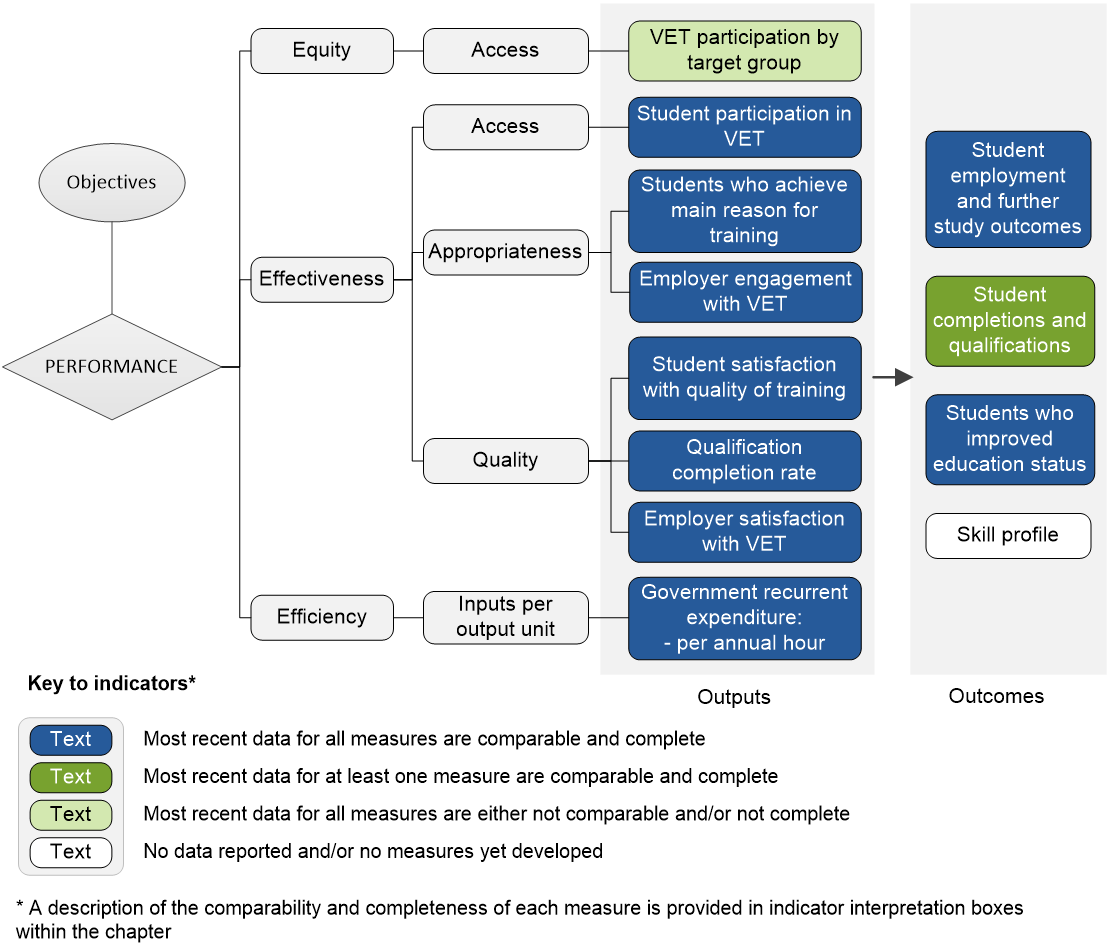
An overview of the VET performance indicator results are presented. Information to assist the interpretation of these data can be found in the indicator interpretation boxes in the VET chapter and attachment tables.
Equity — Access indicators
VET participation by target group
Participation rate for Aboriginal and Torres Strait Islander Australians aged 15–64 years, 2015
| NSW | Vic | Qld | WA | SA | Tas | ACT | NT | Aust | |
|---|---|---|---|---|---|---|---|---|---|
| % | 19.9 | 18.2 | 11.1 | 19.0 | 15.4 | 8.9 | 12.2 | 16.9 | 16.1 |
Effectiveness — Access indicators
Student participation in VET
Participation rate for the population aged 15–64 years, 2015
| NSW | Vic | Qld | WA | SA | Tas | ACT | NT | Aust | |
|---|---|---|---|---|---|---|---|---|---|
| % | 6.5 | 9.6 | 7.0 | 7.2 | 7.6 | 8.6 | 6.1 | 12.2 | 7.6 |
Effectiveness — Appropriateness indicators
Students who achieve their main reason for training
Proportion of government funded VET graduates who indicated that they achieved or partly achieved their main reason for doing the course, 2015
| NSW | Vic | Qld | WA | SA | Tas | ACT | NT | Aust | |
|---|---|---|---|---|---|---|---|---|---|
| Helped achieve main reason | 67.1 ± 1.1 | 60.8 ± 2.4 | 62.1 ± 2.2 | 69.8 ± 1.3 | 64.1 ± 2.1 | 68.8 ± 2.1 | 68.6 ± 3.2 | 79.2 ± 3.0 | 64.5 ± 0.9 |
| Partly helped achieve main reason | 15.2 ± 0.9 | 16.2 ± 1.9 | 14.6 ± 1.7 | 14.3 ± 1.0 | 16.2 ± 1.6 | 14.4 ± 1.6 | 15.2 ± 2.6 | 10.6 ± 2.4 | 15.3 ± 0.7 |
Source: Attachment table 5A.21
Employer engagement with VET
Proportion of employers who in the last twelve months had employees with formal vocational qualifications as a requirement of their job, 2015
| NSW | Vic | Qld | WA | SA | Tas | ACT | NT | Aust | |
|---|---|---|---|---|---|---|---|---|---|
| % | 39.6 ± 3.8 | 31.2 ± 3.5 | 39.5 ± 4.1 | 38.3 ± 4.0 | 30.7 ± 3.7 | 34.8 ± 4.7 | 33.2 ± 3.5 | 42.7 ± 4.8 | 36.6 ± 1.9 |
Source: Attachment table 5A.33
Effectiveness — Quality indicators
Student satisfaction with quality of training
Proportion of government funded VET graduates who were satisfied with the quality of their completed VET course, 2015
| NSW | Vic | Qld | WA | SA | Tas | ACT | NT | Aust | |
|---|---|---|---|---|---|---|---|---|---|
| % | 88.9 ± 0.8 | 84.1 ± 1.8 | 86.3 ± 1.7 | 87.8 ± 1.0 | 88.5 ± 1.4 | 88.8 ± 1.5 | 84.9 ± 2.5 | 87.0 ± 2.7 | 86.8 ± 0.7 |
Source: Attachment table 5A.27
Qualification completion rate
Program completion rate for all government-funded students plus fee-for-service students of government providers (TAFEs and other), commencing 2014
| NSW | Vic | Qld | WA | SA | Tas | ACT | NT | Aust | |
|---|---|---|---|---|---|---|---|---|---|
| % | 38.6 | 35.9 | 43.9 | 37.6 | 32.8 | 35.8 | 39.4 | 35.3 | 38.0 |
Source: Attachment table 5A.35
Subject load pass rate (government funded VET), 2015
| NSW | Vic | Qld | WA | SA | Tas | ACT | NT | Aust | |
|---|---|---|---|---|---|---|---|---|---|
| % | 79.0 | 79.5 | 93.3 | 83.5 | 86.8 | 81.4 | 84.5 | 81.9 | 83.0 |
Source: Attachment table 5A.36
Employer satisfaction with VET
Proportion of employers who were engaged with the VET system in the last 12 months, and were satisfied with VET in meeting their skill needs — Satisfaction with formal vocational qualifications as a job requirement, 2015
| NSW | Vic | Qld | WA | SA | Tas | ACT | NT | Aust | |
|---|---|---|---|---|---|---|---|---|---|
| % | 73.7 ± 5.7 | 79.1 ± 5.2 | 75.9 ± 5.8 | 78.9 ± 5.6 | 77.7 ± 6.1 | 79.6 ± 5.8 | 77.9 ± 5.8 | 76.1 ± 6.4 | 76.2 ± 2.8 |
Efficiency — Inputs per output unit indicators
Government recurrent expenditure per annual hour
Government recurrent expenditure (including User Cost of Capital) per government funded annual hour, 2015
| NSW | Vic | Qld | WA | SA | Tas | ACT | NT | Aust | |
|---|---|---|---|---|---|---|---|---|---|
| $ | 25.22 | 10.76 | 14.32 | 18.48 | 18.44 | 19.72 | 20.42 | 28.15 | 16.16 |
Outcome indicators
Student employment and further study outcomes
Proportion of government funded VET graduates who were employed and/or continued on to further study in 2015 after completing their course in 2014
| NSW | Vic | Qld | WA | SA | Tas | ACT | NT | Aust | |
|---|---|---|---|---|---|---|---|---|---|
| % | 85.5 ± 0.8 | 82.9 ± 1.9 | 81.7 ± 1.9 | 88.5 ± 0.9 | 87.6 ± 1.5 | 88.1 ± 1.4 | 91.8 ± 1.8 | 89.4 ± 2.3 | 84.6 ± 0.7 |
Proportion of government funded VET graduates who improved their employment circumstances after training, 2015
| NSW | Vic | Qld | WA | SA | Tas | ACT | NT | Aust | |
|---|---|---|---|---|---|---|---|---|---|
| % | 58.8 ± 1.2 | 54.7 ± 2.5 | 59.4 ± 2.3 | 61.0 ± 1.4 | 60.4 ± 2.2 | 61.0 ± 2.2 | 63.6 ± 3.3 | 65.9 ± 3.7 | 58.2 ± 1.0 |
Student completions and qualifications
Qualifications completed by working aged VET students, per 1000 people aged 15–64 years, 2015
| NSW | Vic | Qld | WA | SA | Tas | ACT | NT | Aust | |
|---|---|---|---|---|---|---|---|---|---|
| no. | 22.4 | 37.5 | 36.9 | 26.8 | 25.9 | 28.5 | 27.9 | 28.9 | 30.1 |
Students who improved education status
Proportion of graduates with improved education/training status after training, of all AQF qualifications completed, 2015
| NSW | Vic | Qld | WA | SA | Tas | ACT | NT | Aust | |
|---|---|---|---|---|---|---|---|---|---|
| % | 62.1 | 75.2 | 72.1 | 60.9 | 52.2 | 56.1 | 41.8 | 61.9 | 67.5 |
Notes
These data and caveats for these data are available in chapter 5 and attachment 5A.
Some percentages reported in these tables include 95 per cent confidence intervals (for example, 80 per cent ± 2.7 per cent).
Performance indicator data for Aboriginal and Torres Strait Islander people in this chapter are available in the attachment tables listed below. Contextual data and further supporting information can be found in the chapter.
| Table number | Table title |
|---|---|
| Participation | |
| Table 5A.12 | Government-funded VET participation, by target age group and Indigenous status |
| Table 5A.18 | Government-funded VET participation by Indigenous status (per cent) |
| Table 5A.19 | Government-funded VET participation in Certificate III and above, by target age group and Indigenous status |
| Table 5A.20 | Government-funded VET participation in diploma and above, by target age group and Indigenous status |
| Achieved main reason | |
| Table 5A.22 | Whether course helped graduates achieve their main reason for undertaking training, Aboriginal and Torres Strait Islander graduates (per cent) |
| Table 5A.23 | Whether course helped graduates achieve their main reason for undertaking training, non-Indigenous graduates (per cent) |
| Student satisfaction | |
| Table 5A.28 | Proportion of Aboriginal and Torres Strait Islander graduates who were satisfied with the quality of their completed course, by purpose of study (per cent) |
| Table 5A.29 | Proportion of non-Indigenous graduates who were satisfied with the quality of their completed course, by purpose of study (per cent) |
| Qualification completion rate | |
| Table 5A.36 | Government-funded subject load pass rates by Indigenous status (per cent) |
| Employment and further study outcomes | |
| Table 5A.45 | Proportion of Aboriginal and Torres Strait Islander government-funded VET graduates in employment and/or continued on to further study after completing a course |
| Table 5A.46 | Proportion of non-Indigenous VET graduates in employment and/or continued on to further study after completing a course |
| Table 5A.51 | Labour force status after the course of Aboriginal and Torres Strait Islander VET graduates who were unemployed prior to the course (per cent) |
| Table 5A.52 | Labour force status after the course of non-Indigenous VET graduates who were unemployed prior to the course (per cent) |
| Table 5A.56 | Aboriginal and Torres Strait Islander VET graduates who undertook their course for employment related reasons, by job related benefits (per cent) |
| Table 5A.59 | Proportion of Aboriginal and Torres Strait Islander VET graduates who improved their employment circumstances after training |
| Table 5A.60 | Proportion of non-Indigenous VET graduates who improved their employment circumstances after training |
| Table 5A.61 | Proportion of VET graduates who improved their employment circumstances after training, by Indigenous status |
| Table 5A.63 | Proportion of VET graduates aged 20–64 years who improved their employment circumstances after training, by Indigenous status |
| Completions and qualifications | |
| Table 5A.70 | Number of government-funded VET qualifications completed by students, by course level and Indigenous status, preliminary — all ages |
| Table 5A.71 | Number of government-funded VET qualifications completed by students, by course level and Indigenous status, preliminary — students aged 18–24 years |
| Table 5A.72 | Number of government-funded VET qualifications completed by students, by course level and Indigenous status, preliminary — students aged 20–64 years |
| Table 5A.73 | Number of government-funded VET qualifications completed by students, by course level and Indigenous status, preliminary — students aged 15–64 years |
| Table 5A.74 | Government-funded qualification equivalents, by course level and Indigenous status |
| Table 5A.78 | Government-funded units of competency and modules completed, by Indigenous status |
| Improved education status | |
| Table 5A.79 | Government-funded VET qualification completions with improved education/training status after training, by Indigenous status, all students |
| Table 5A.80 | Government-funded VET qualification completions with improved education/training status after training, by Indigenous status, students aged 20–64 years |