Report on Government Services 2018
Part E, Chapter 13
Mental health management
This chapter reports on the performance of governments managing of mental health and mental illnesses.
Download the chapter
- Chapter 13 Mental health management and attachment tables (PDF - 2966 Kb)
- Chapter 13 Mental health management (Word - 230 Kb)
- Chapter 13 Attachment tables (XLSX - 1645 Kb)
- Key Facts
- Indicator Framework
- Indicator Results
- Indigenous Data
Real government recurrent expenditure of around $8.5 billion was allocated to mental health services in 2015‑16, equivalent to $355 per person in the population. State and Territory governments made the largest contribution ($5.4 billion or 63.1 per cent, which includes Australian Government funding under the NHRA), with Australian Government expenditure of $3.1 billion.
In 2015-16, 1.8 per cent of the total population received State and Territory governments’ specialised mental health services (including inpatient/admitted care in hospitals, community based ambulatory care and community based residential care) and 9.6 per cent of the total population received MBS/DVA subsidised mental health services.
Mental health services aim to:
- promote mental health and wellbeing, and where possible prevent the development of mental health problems, mental illness and suicide, and
- when mental health problems and illness do occur, reduce the impact (including the effects of stigma and discrimination), promote recovery and physical health and encourage meaningful participation in society, by providing services that:
- are high quality, safe and responsive to consumer and carer goals
- facilitate early detection of mental health issues and mental illness, followed by appropriate intervention
- are coordinated and provide continuity of care
- are timely, affordable and readily available to those who need them
- are sustainable.
Governments aim for mental health services to meet these objectives in an equitable and efficient manner.
The performance indicator framework provides information on equity, efficiency and effectiveness, and distinguishes the outputs and outcomes of mental health management. The performance indicator framework shows which data are complete and comparable in the 2018 Report.
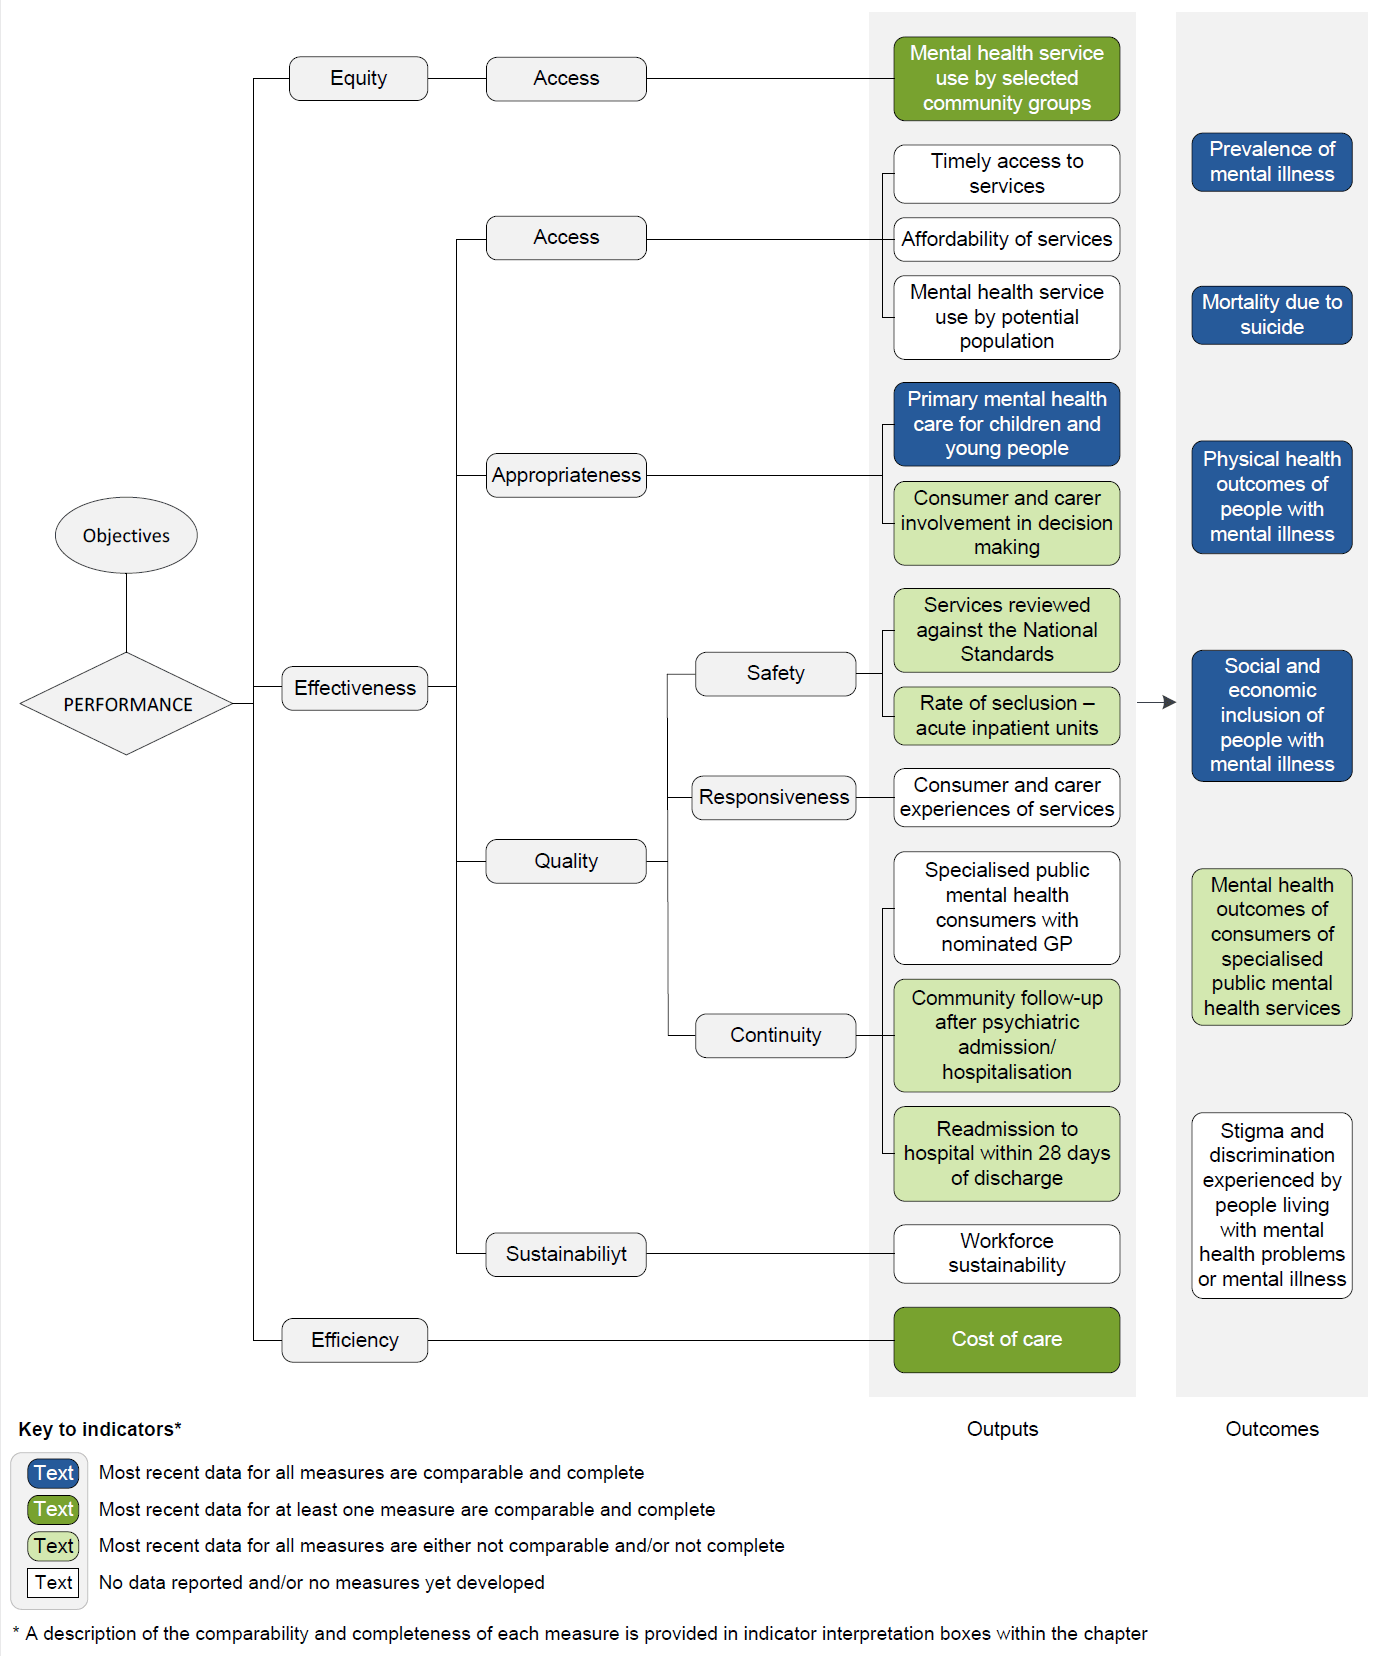
An overview of the Mental health management performance indicator results are presented. Information to assist the interpretation of these data can be found in the indicator interpretation boxes in the Mental health management chapter and attachment tables.
Equity — Access indicators
Mental health service use by selected community groups
Proportion of the Aboriginal and Torres Strait Islander population using State and Territory specialised public mental health services, compared with the proportion for non‑Indigenous population, 2015‑16 (per cent)
| NSW | Vic | Qld | WA | SA | Tas | ACT | NT | Aust | |
|---|---|---|---|---|---|---|---|---|---|
| Aboriginal and Torres Strait Islander people | 6.1 | 3.3 | 4.9 | 6.1 | 7.1 | 2.7 | 8.8 | 4.3 | 5.3 |
| Non-Indigenous people | 1.6 | 1.1 | 1.9 | 2.0 | 2.0 | 2.1 | 2.5 | 2.3 | 1.6 |
Proportion of the Aboriginal and Torres Strait Islander population using MBS subsidised mental health services, compared with the proportion for non‑Indigenous population, 2015‑16 (per cent)
| NSW | Vic | Qld | WA | SA | Tas | ACT | NT | Aust | |
|---|---|---|---|---|---|---|---|---|---|
| Aboriginal and Torres Strait Islander people | 13.8 | 16.2 | 9.8 | 6.1 | 11.3 | 11.4 | 14.7 | 2.2 | 10.4 |
| Non-Indigenous people | 9.5 | 10.7 | 9.9 | 7.8 | 9.4 | 9.2 | 8.0 | 5.2 | 9.6 |
Effectiveness — Appropriateness indicators
Primary mental health care for children and young people
Proportion of young people aged under 25 years who had contact with MBS subsidised primary mental health care services, 2016‑17
| NSW | Vic | Qld | WA | SA | Tas | ACT | NT | Aust | |
|---|---|---|---|---|---|---|---|---|---|
| % | 7.6 | 8.5 | 8.2 | 6.6 | 7.8 | 8.4 | 7.2 | 3.3 | 7.8 |
Consumer and carer involvement in decision making
Number of paid FTE consumer and carer staff per 1000 FTE paid direct care staff, 2015‑16 (rate)
| NSW | Vic | Qld | WA | SA | Tas | ACT | NT | Aust | |
|---|---|---|---|---|---|---|---|---|---|
| Consumer staff | 3.1 | 2.8 | 9.1 | 1.7 | 8.3 | 3.7 | – | 3.1 | 4.4 |
| Carer staff | 0.8 | 2.6 | 3.7 | 0.2 | 1.5 | 0.8 | – | 1.3 | 1.7 |
Effectiveness — Quality — Safety indicators
Services reviewed against the National Standards
Proportion of expenditure on specialised public mental health services that had completed an external review against national standards and were assessed as meeting ‘all Standards’ (level 1), June 2016
| NSW | Vic | Qld | WA | SA | Tas | ACT | NT | Aust | |
|---|---|---|---|---|---|---|---|---|---|
| % | 89.7 | 81.7 | 99.5 | 90.2 | 21.0 | 13.7 | 100.0 | 98.1 | 82.9 |
Rate of seclusion ― acute inpatient units
Number of seclusion events per 1000 bed days in specialised public mental health acute inpatient units, 2016‑17
| NSW | Vic | Qld | WA | SA | Tas | ACT | NT | Aust | |
|---|---|---|---|---|---|---|---|---|---|
| Rate | 6.9 | 9.3 | 7.9 | 4.8 | 6.6 | 10.2 | 2.8 | 17.0 | 7.4 |
Effectiveness — Quality — Continuity indicators
Community follow‑up after psychiatric admission/hospitalisation
Proportion of State and Territory governments’ specialised public admitted patient overnight acute separations from psychiatric units for which a community‑based ambulatory contact was recorded in the seven days following separation, 2015-16
| NSW | Vic | Qld | WA | SA | Tas | ACT | NT | Aust | |
|---|---|---|---|---|---|---|---|---|---|
| % | 66.0 | 70.7 | 75.4 | 61.9 | 59.8 | 79.2 | 73.7 | 65.1 | 68.2 |
Readmissions to hospital within 28 days of discharge
Proportion of State and Territory governments’ admitted patient overnight separations from psychiatric acute inpatient units that were followed by readmission to a psychiatric acute inpatient unit within 28 days of discharge, 2015-16
| NSW | Vic | Qld | WA | SA | Tas | ACT | NT | Aust | |
|---|---|---|---|---|---|---|---|---|---|
| % | 14.8 | 15.2 | 13.6 | 17.8 | 10.1 | 14.5 | 13.6 | 11.3 | 14.6 |
Source: Attachment table 13A.31
Efficiency indicators
Cost of care
Cost of inpatient care, 2015-16 ($ per bed day)
| NSW | Vic | Qld | WA | SA | Tas | ACT | NT | Aust | |
|---|---|---|---|---|---|---|---|---|---|
| General mental health services (acute units) | 1210.95 | 931.17 | 983.63 | 1509.04 | 1250.82 | 1054.11 | 1170.32 | 2081.99 | 1153.42 |
| General hospital with a psychiatric unit or ward (acute units) | 1200.75 | 928.56 | 1021.30 | 1527.71 | 1225.40 | 1250.66 | 1077.12 | 2081.99 | 1146.64 |
Cost of community-based residential care, general adult units — 24 hour staffed units, 2015-16 (average cost per patient day)
| NSW | Vic | Qld | WA | SA | Tas | ACT | NT | Aust | |
|---|---|---|---|---|---|---|---|---|---|
| $ per patient day | 284.28 | 510.48 | .. | 511.93 | 509.89 | 606.26 | 772.85 | 712.11 | 514.37 |
Cost of ambulatory care, 2015-16 (average cost per treatment day)
| NSW | Vic | Qld | WA | SA | Tas | ACT | NT | Aust | |
|---|---|---|---|---|---|---|---|---|---|
| $ per treatment day | 216.34 | 384.61 | 333.02 | 460.72 | 333.73 | 303.53 | 223.81 | 466.43 | 305.45 |
Outcome indicators
Prevalence of mental illness
Proportion of people with lifetime mental disorders (with symptoms in the previous 12 months) among adults aged 16–85 years, 2007
| NSW | Vic | Qld | WA | SA | Tas | ACT | NT | Aust | |
|---|---|---|---|---|---|---|---|---|---|
| % | 20.1 ± 2.2 | 20.7 ± 2.3 | 19.2 ± 2.6 | 21.4 ± 4.1 | 19.1 ± 3.4 | 14.1 ± 5.4 | np | np | 20.0 ± 1.1 |
Mortality due to suicide
Suicide rate per 100 000 people, 2012–2016
| NSW | Vic | Qld | WA | SA | Tas | ACT | NT | Aust | |
|---|---|---|---|---|---|---|---|---|---|
| Rate | 10.1 | 9.9 | 14.4 | 14.4 | 12.9 | 14.8 | 8.9 | 19.0 | 11.8 |
Physical health outcomes for people with a mental illness
Proportion of people with a mental illness (compared to the proportion for people without a mental illness) who experienced asthma, 2014-15 (per cent)
| NSW | Vic | Qld | WA | SA | Tas | ACT | NT | Aust | |
|---|---|---|---|---|---|---|---|---|---|
| People with mental or behavioural problems | 18.1 ± 3.9 | 19.1 ± 3.6 | 16.3 ± 4.3 | 14.1 ± 4.5 | 16.9 ± 5.0 | 18.5 ± 4.6 | 18.4 ± 5.3 | 13.7 ± 6.6 | 17.4 ± 1.6 |
| People without mental or behavioural problems | 8.1 ± 1.5 | 10.1 ± 1.6 | 9.1 ± 1.5 | 8.1 ± 1.5 | 9.8 ± 1.6 | 11.2 ± 2.1 | 9.9 ± 2.3 | 8.9 ± 3.6 | 9.0 ± 0.7 |
Social and economic inclusion of people with a mental illness
Proportion of people aged 15 years or over with a mental illness who had face-to-face contact with family or friends living outside the household in the last week, compared with the proportion for people without a mental illness, 2014
| NSW | Vic | Qld | WA | SA | Tas | ACT | NT | Aust | |
|---|---|---|---|---|---|---|---|---|---|
| People with mental illness | 75.4 ± 7.3 | 79.0 ± 5.3 | 72.5 ± 5.2 | 77.0 ± 6.6 | 81.7 ± 8.1 | 78.1 ± 5.2 | 76.3 ± 5.9 | 54.8 ± 11.5 | 76.5 ± 3.1 |
| People without mental illness | 75.1 ± 2.8 | 77.9 ± 3.1 | 75.6 ± 3.3 | 77.4 ± 3.1 | 85.1 ± 2.1 | 86.5 ± 2.8 | 75.8 ± 2.6 | 69.6 ± 4.6 | 77.1 ± 1.4 |
Mental health outcomes of consumers of specialised public mental health services
Proportion of people discharged from a State or Territory public hospital psychiatric inpatient unit who had a significant improvement in their clinical mental health outcomes, 2015‑16
| NSW | Vic | Qld | WA | SA | Tas | ACT | NT | Aust | |
|---|---|---|---|---|---|---|---|---|---|
| % | 68.7 | 75.2 | 74.7 | 72.5 | 65.1 | 74.8 | np | 78.7 | 72.5 |
Notes
These data and caveats for these data are available in chapter 13 and attachment 13A.
Some percentages reported in these tables include 95 per cent confidence intervals (for example, 80 per cent ± 2.7 per cent).
.. Not applicable. – Nil or rounded to zero. np Not published.
Performance indicator data for Aboriginal and Torres Strait Islander people in this chapter are available in the attachment tables listed below. Contextual data and further supporting information can be found in the chapter.
| Table number | Table title |
|---|---|
| Table 13A.16 | Proportion of people receiving clinical mental health services by service type and Indigenous status |
| Table 13A.19 | Proportion of young people (aged < 25 years) who had contact with MBS subsidised primary mental health care services, by selected characteristics (per cent) |
| Table 13A.27 | Rates of community follow up within first seven days of discharge from a psychiatric admission, by State and Territory, by Indigenous status and remoteness |
| Table 13A.30 | Readmissions to hospital within 28 days of discharge, by selected characteristics, 2015-16 |
| Table 13A.44 | Age-standardised rate of adults with high/ very high levels of psychological distress, by State and Territory, by Indigenous status |
| Table 13A.51 | Suicide deaths, by Indigenous status, 2012–2016 |