Report on Government Services 2019
Part C, Chapter 6
6 Police services
The focus of performance reporting in this chapter is on police services, covering the operations of the police agencies of each State and Territory government, including the ACT community policing function performed by the Australian Federal Police.
Download the chapter
- Chapter 6 Police services and attachment tables (PDF - 1988 Kb)
- Chapter 6 Police services (Word - 450 Kb)
- Chapter 6 Attachment tables (XLSX - 877 Kb)
Note: An errata was released with this part reflecting updates to the files above.
Errata
The following data have changed for Chapter 6 Police services:
- Amended data for police services expenditure for 2013-14 to 2016-17 for NSW and Australia, and for 2012-13 for all jurisdictions. Affects attachment table 6A.1 and figure 6.13.
- Key Facts
- Indicator Framework
- Indicator Results
- Indigenous Data
The focus of performance reporting in this chapter is on police services, covering the operations of the police agencies of each State and Territory government, including the ACT community policing function performed by the Australian Federal Police.
Real recurrent expenditure on policing services across Australia was approximately $11.6 billion (or $469.20 per person) in 2017-18.
Police agencies employed 74 330 staff in 2017-18 (277 operational and 24 non-operational staff per 100 000 people).
Police services aim to contribute to a safe and secure community that enables people to undertake their lawful pursuits confidently and safely. To achieve these aims, governments seek to provide police services that:
- are accessible, and responsive to community needs, including disaster and emergency management
- support the judicial process to bring to justice those people responsible for committing an offence
- provide safe custodial services
- are delivered with integrity, honesty and fairness
- promote safer behaviour on roads.
Governments aim for police services to meet these objectives in an equitable and efficient manner.
The performance indicator framework provides information on equity, efficiency and effectiveness, and distinguishes the outputs and outcomes of police services. The performance indicator framework shows which data are complete and comparable in the 2019 Report.
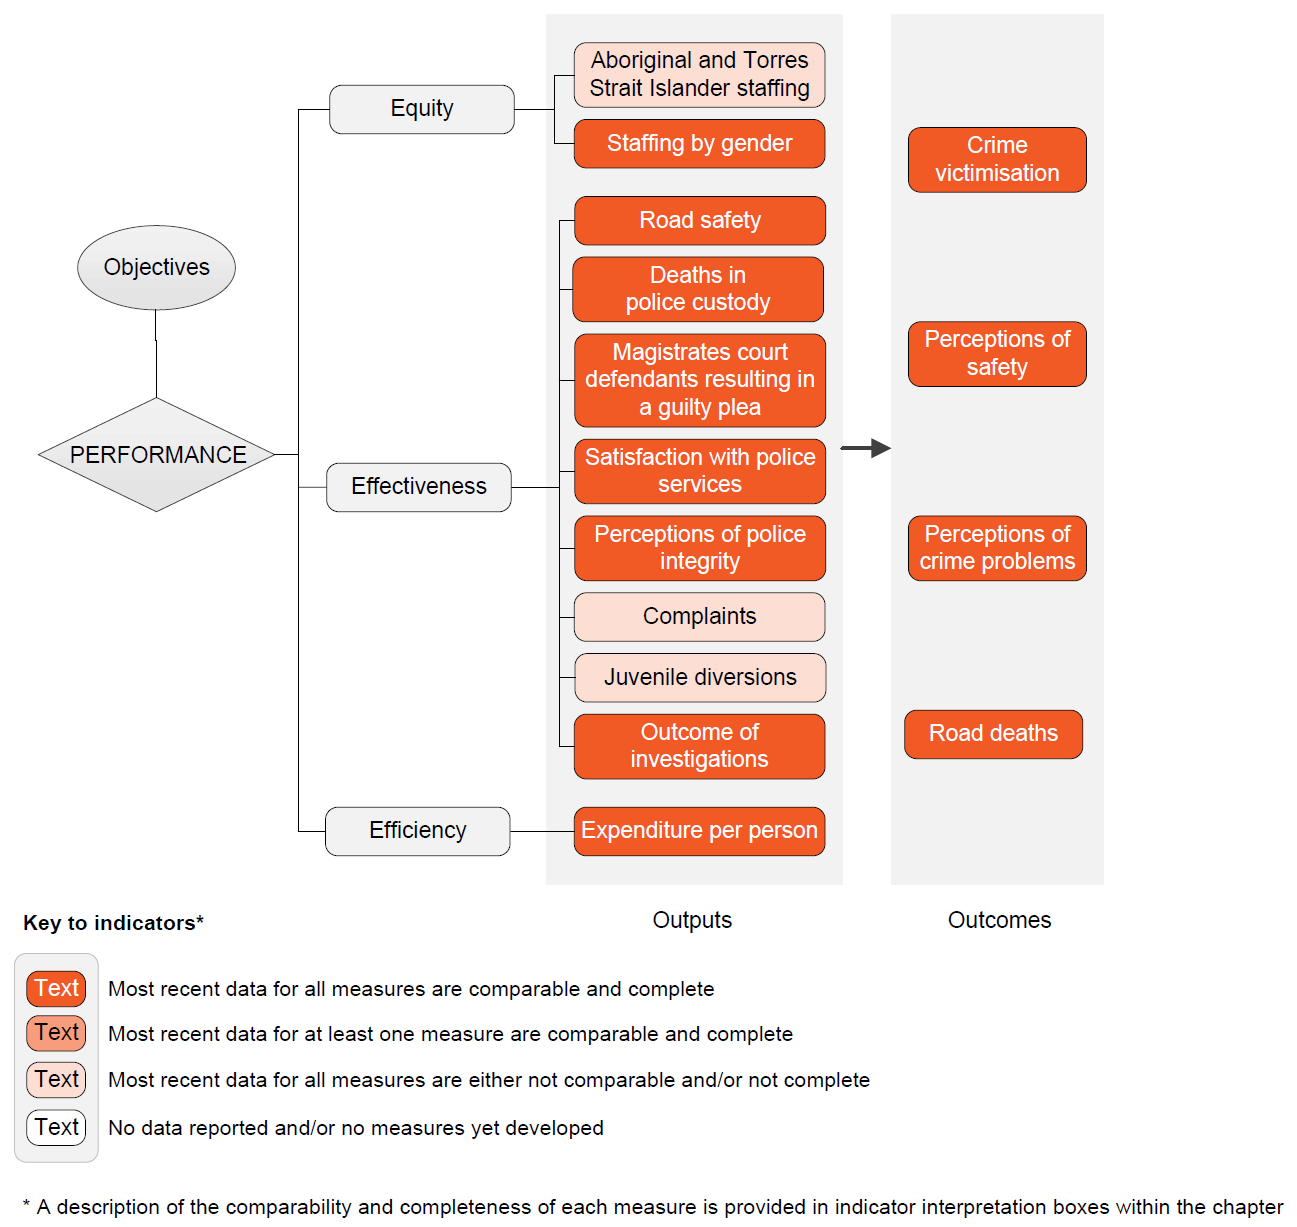
An overview of the Police services performance indicator results are presented. Information to assist the interpretation of these data can be found in the indicator interpretation boxes in the Police services chapter and attachment tables.
Equity indicators
Aboriginal and Torres Strait Islander staffing
Proportion of all police staff who self-identify as Aboriginal and/or Torres Strait Islander, 2017-18
| NSW | Vic | Qld | WA | SA | Tas | ACT | NT | Aust | |
|---|---|---|---|---|---|---|---|---|---|
| % | 3.1 | 0.4 | 2.4 | 1.9 | 1.4 | 1.6 | 2.0 | 9.8 | 2.1 |
Staffing by gender
Proportion of all police staff who are female, 2017-18
| NSW | Vic | Qld | WA | SA | Tas | ACT | NT | Aust | |
|---|---|---|---|---|---|---|---|---|---|
| % | 32.9 | 32.5 | 36.0 | 31.4 | 33.8 | 37.7 | 37.7 | 37.0 | 33.6 |
Effectiveness indicators
Road safety
Proportion of people who had driven in the previous 6 months and who indicated that, in that time, they had driven when possibly over the alcohol limit, 2017-18
| NSW | Vic | Qld | WA | SA | Tas | ACT | NT | Aust | |
|---|---|---|---|---|---|---|---|---|---|
| % | 6.7 ± 1.7 | 7.6 ± 1.0 | 6.8 ± 1.2 | 11.0 ± 2.6 | 9.9 ± 1.9 | 7.9 ± 1.8 | 8.3 ± 1.4 | 11.0 ± 1.9 | 7.7 ± 0.7 |
Source: Attachment table 6A.17
Deaths in police custody
The number of total deaths and Aboriginal and Torres Strait Islander deaths in police custody and custody related operations, 2016-17 (number)
| NSW | Vic | Qld | WA | SA | Tas | ACT | NT | Aust | |
|---|---|---|---|---|---|---|---|---|---|
| Total deaths | 6 | – | 2 | 2 | 5 | – | – | 2 | 17 |
| Aboriginal and Torres Strait Islander deaths | 2 | – | – | 1 | 2 | – | – | 1 | 6 |
Magistrates court defendants resulting in a guilty plea or finding
The number of finalised adjudicated defendants in lower courts who either submitted a guilty plea or were found guilty, as a proportion of the total number of magistrates court adjudicated defendants, 2016-17
| NSW | Vic | Qld | WA | SA | Tas | ACT | NT | Aust | |
|---|---|---|---|---|---|---|---|---|---|
| % | 95.6 | 99.9 | 99.3 | 99.3 | 99.4 | 87.2 | 95.7 | 97.3 | 98.1 |
Source: Attachment table 6A.22
Satisfaction with police services
Proportion of people satisfied or very satisfied with services provided by police, 2017-18
| NSW | Vic | Qld | WA | SA | Tas | ACT | NT | Aust | |
|---|---|---|---|---|---|---|---|---|---|
| % | 80.1 ± 2.9 | 78.9 ± 1.6 | 80.3 ± 1.9 | 77.6 ± 2.8 | 83.1 ± 2.8 | 88.0 ± 2.1 | 82.5 ± 2.3 | 75.3 ± 3.1 | 79.9 ± 1.1 |
Source: Attachment table 6A.4
Perceptions of police integrity
Proportion of people who agree or strongly agree that ‘police perform job professionally’, 2017-18
| NSW | Vic | Qld | WA | SA | Tas | ACT | NT | Aust | |
|---|---|---|---|---|---|---|---|---|---|
| % | 86.4 ± 2.6 | 86.8 ± 1.3 | 86.1 ± 1.7 | 89.0 ± 1.9 | 89.6 ± 1.9 | 91.5 ± 1.7 | 88.9 ± 2.2 | 80.9 ± 3.0 | 87.1 ± 1.0 |
Source: Attachment table 6A.7
Complaints
The number of complaints made by members of the public against police, per 100 000 people in the population, 2017-18 (indexed to base years of 2008-09 to 2010-11=100)
| NSW | Vic | Qld | WA | SA | Tas | ACT | NT | Aust | |
|---|---|---|---|---|---|---|---|---|---|
| no. | 75.5 | 82.2 | 52.8 | 76.4 | 108.9 | 188.1 | 23.5 | 124.6 | .. |
Juvenile diversions
The total number of alleged young offenders who would otherwise be proceeded against (that is, taken to court) but who are diverted by police, as a proportion of all juvenile offenders formally dealt with by police, 2017-18
| NSW | Vic | Qld | WA | SA | Tas | ACT | NT | Aust | |
|---|---|---|---|---|---|---|---|---|---|
| Total diversions | 50.4 | 22.0 | 61.0 | 46.4 | 41.1 | 46.0 | 31.9 | 46.8 | .. |
| Aboriginal and Torres Strait Islander diversions | 23.8 | 12.6 | 46.0 | 36.9 | 27.6 | na | 14.2 | 45.0 | .. |
Outcomes of investigations
Proportion of investigations finalised, with offender proceeded against, within 30 days of the offence becoming known to police – sexual assault, 2017
| NSW | Vic | Qld | WA | SA | Tas | ACT | NT | Aust | |
|---|---|---|---|---|---|---|---|---|---|
| % | 33.4 | 59.5 | 57.2 | 32.8 | 72.6 | 78.2 | 21.1 | 54.3 | .. |
Efficiency indicators
Dollars per person
Expenditure on police services per person, 2017-18
| NSW | Vic | Qld | WA | SA | Tas | ACT | NT | Aust | |
|---|---|---|---|---|---|---|---|---|---|
| $ | 406.5 | 476.8 | 458.3 | 559.6 | 477.1 | 483.7 | 412.0 | 1 576.7 | 469.2 |
Outcome indicators
Crime victimisation
Estimated victimisation rate for sexual assault per 100 000 people aged 18 years or over, 2016-17
| NSW | Vic | Qld | WA | SA | Tas | ACT | NT | Aust | |
|---|---|---|---|---|---|---|---|---|---|
| no. | 530.4 ± 198.6 | 430.1 ± 267.2 | 359.1 ± 205.5 | 342.9 ± 221.1 | 365.6 ± 336.1 | 303.3 ± np | 549.8 ± np | 745.7 ± np | 437.9 ± 89.3 |
Source: Attachment table 6A.11
Perceptions of safety
Proportion of people who felt ‘safe’ or ‘very safe’ walking alone during the night, 2017-18
| NSW | Vic | Qld | WA | SA | Tas | ACT | NT | Aust | |
|---|---|---|---|---|---|---|---|---|---|
| % | 57.7 ± 3.3 | 47.1 ± 2.0 | 53.2 ± 2.2 | 51.3 ± 3.1 | 54.3 ± 3.2 | 59.6 ± 3.7 | 59.1 ± 3.1 | 44.1 ± 3.4 | 53.1 ± 1.3 |
Proportion of people who felt ‘safe’ or ‘very safe’ travelling on public transport at night, 2017‑18
| NSW | Vic | Qld | WA | SA | Tas | ACT | NT | Aust | |
|---|---|---|---|---|---|---|---|---|---|
| % | 35.1 ± 3.3 | 31.3 ± 2.1 | 32.2 ± 2.2 | 25.3 ± 2.8 | 32.3 ± 3.3 | 26.9 ± 3.8 | 40.0 ± 3.3 | 15.9 ± 2.6 | 32.1 ± 1.3 |
Perceptions of crime problems
Proportion of people who perceive illegal drugs to be ‘somewhat of a problem’ or a ‘major problem’ in the neighbourhood, 2017‑18
| NSW | Vic | Qld | WA | SA | Tas | ACT | NT | Aust | |
|---|---|---|---|---|---|---|---|---|---|
| % | 49.8 ± 3.4 | 52.0 ± 2.0 | 46.2 ± 2.2 | 55.1 ± 3.2 | 44.7 ± 3.2 | 46.4 ± 3.9 | 37.6 ± 3.1 | 53.7 ± 3.4 | 49.6 ± 1.4 |
Source: Attachment table 6A.6
Road deaths
The number of road deaths per 100 000 registered vehicles, 2017-18
| NSW | Vic | Qld | WA | SA | Tas | ACT | NT | Aust | |
|---|---|---|---|---|---|---|---|---|---|
| no. | 6.9 | 4.9 | 6.1 | 7.4 | 7.0 | 7.3 | 2.3 | 25.8 | 6.4 |
Notes
These data and caveats for these data are available in Chapter 6 and Attachment 6A. Some percentages reported in these tables include 95 per cent confidence intervals (for example, 80 per cent ± 2.7 per cent).
na Not available. .. Not applicable. – Nil or rounded to zero.
Performance indicator data for Aboriginal and Torres Strait Islander people in this chapter are available in the attachment tables listed below. Contextual data and further supporting information can be found in the chapter.
| Table number | Table title |
|---|---|
| Table 6A.3 | Police staffing, 2012-13 to 2017-18 |
| Table 6A.20 | Deaths in police custody, 2007-08 to 2016-17 |
| Table 6A.21 | Juvenile diversions as a proportion of offenders, 2008-09 to 2017-18 |