Report on Government Services 2020
Part D, Section 9: RELEASED ON 29 JANUARY 2020
9 Emergency services for fire and other events
This section is presented in a new online format. Dynamic data visualisations replace the static chapter format used in previous editions. Machine readable data are also available for download. A guide is available on accessing information in the new format.
The focus of performance reporting in this section is on emergency services for fire events. Descriptive information is included on emergency services for other events, with performance reporting to be developed for future Reports.
The Indicator Results tab uses data from the data tables to provide information on the performance for each indicator in the Indicator Framework. The same data are also available in CSV format.
Skip to downloadable Emergency services data tables and supporting material
- Context
- Indicator Framework
- Indicator Results
Objectives for emergency services for fire and other events
Emergency services for fire and other events aim to reduce the adverse effects of events on the community (including people, property, infrastructure, economy and environment). Governments’ involvement is aimed at providing emergency services that:
- contribute to the communities management of risks and its preparedness, through the promotion of risk reduction and mitigation activities
- are accessible, responsive and sustainable.
Governments aim for emergency services to meet these objectives in an equitable and efficient manner.
Service overview
An emergency event is an event that endangers or threatens to endanger life, property and/or the environment, and requires a significant and coordinated response. A fire event is an incident that is reported to a fire service organisation and requires a response. Fire events include (but are not limited to):
- structure fires (that is, fires inside a building or structure), regardless of whether there is damage to the structure
- landscape fires, including bushfires and grass fires, regardless of the size of the area burnt
- other fires, including vehicle and other mobile property fires, and outside rubbish fires
Other events that require an emergency response from fire and/or state and territory emergency services include road crash rescue, floods, storms and other natural disasters.
Roles and responsibilities
Fire service organisations and state and territory emergency services (STES) are some of the primary agencies involved in providing emergency services for fire and other events. The role of these organisations varies across jurisdictions but commonly includes prevention/mitigation, preparedness, response and recovery activities. Detailed activities by jurisdiction for fire service organisations and STES are available in tables 9.1 and 9.2 respectively in the interpretative material.
Each State and Territory government operates multiple emergency service agencies, which service different populations and geographic areas according to specified governance arrangements (table 9.4 in the interpretative material). Fire and STES service organisations work closely with other government departments and agencies that also have responsibilities in the case of fire and other emergency events.This section covers the finances and activities of urban and rural fire service agencies and, for selected tables and jurisdictions, the fire event finances and activities of land management agencies (tables 9A.1–13), and STES (tables 9A.14–18). The scope of fire service organisations data provided by jurisdictions is presented in table 9.3 in the interpretative material.
Funding
In 2018-19, the total revenue of fire service organisations was $4.5 billion and for STES was $254 million (table 9.6).
Jurisdictions have a range of funding models to resource fire service organisations and STES organisations. For fire services and STES, levies were the largest source of revenue (54.2 per cent and 59.5 per cent respectively of total funding in 2018-19) (tables 9A.1 and 9A.14).
The Australian Government provides funding to State and Territory governments through programs including:- The Preparing Australia Package contributed funding for key national emergency management and disaster resilience initiatives. In 2018-19, funding was $26.1 million, with $5.0 million provided to states and territories (table 9A.2).
- The Natural Disaster Relief and Recovery Arrangements provides assistance with relief and recovery efforts following an eligible natural disaster event. Cash payments to states and territories in 2018-19 totalled $390.1 million. Allocations vary across jurisdictions and over time depending on the timing and nature of natural disaster events (table 9A.2).
- The Natural Disaster Resilience Program provided funding to strengthen community resilience to natural disasters. In 2018-19, funding was $15.1 million (table 9A.2).
The Australian Government also provides financial support to eligible individuals affected by a disaster, with payments in 2018-19 of $121.7 million (table 9A.2).
Size and scope
Human resources
Nationally in 2018-19, 20 692 full time equivalent (FTE) paid personnel were employed by fire service organisations, with the majority (76.4 per cent) firefighters. A large number of volunteer personnel (207 445 people) also participated in the delivery of services in 2018-19. The proportion of volunteer personnel and the nature of their role varied across jurisdictions (table 9A.3).
For STES, the majority of personnel were volunteers, with 23 796 state and territory emergency services volunteers and 737 paid staff in 2018-19 (table 9A.16). The proportion of volunteer and paid personnel and the nature of their roles varied across jurisdictions (table 9A.16).
Demand for emergency services
Fire service organisations and STES provide emergency response and rescue services for a range of fire and other emergency events. Nationally in 2018-19, fire service organisations attended a total of 391 382 emergency incidents, of which 96 343 were fire events (table 9A.8) and STES organisations attended a total of 68 118 incidents (excluding Queensland), of which 57 922 were storm and cyclone events (table 9A.17).
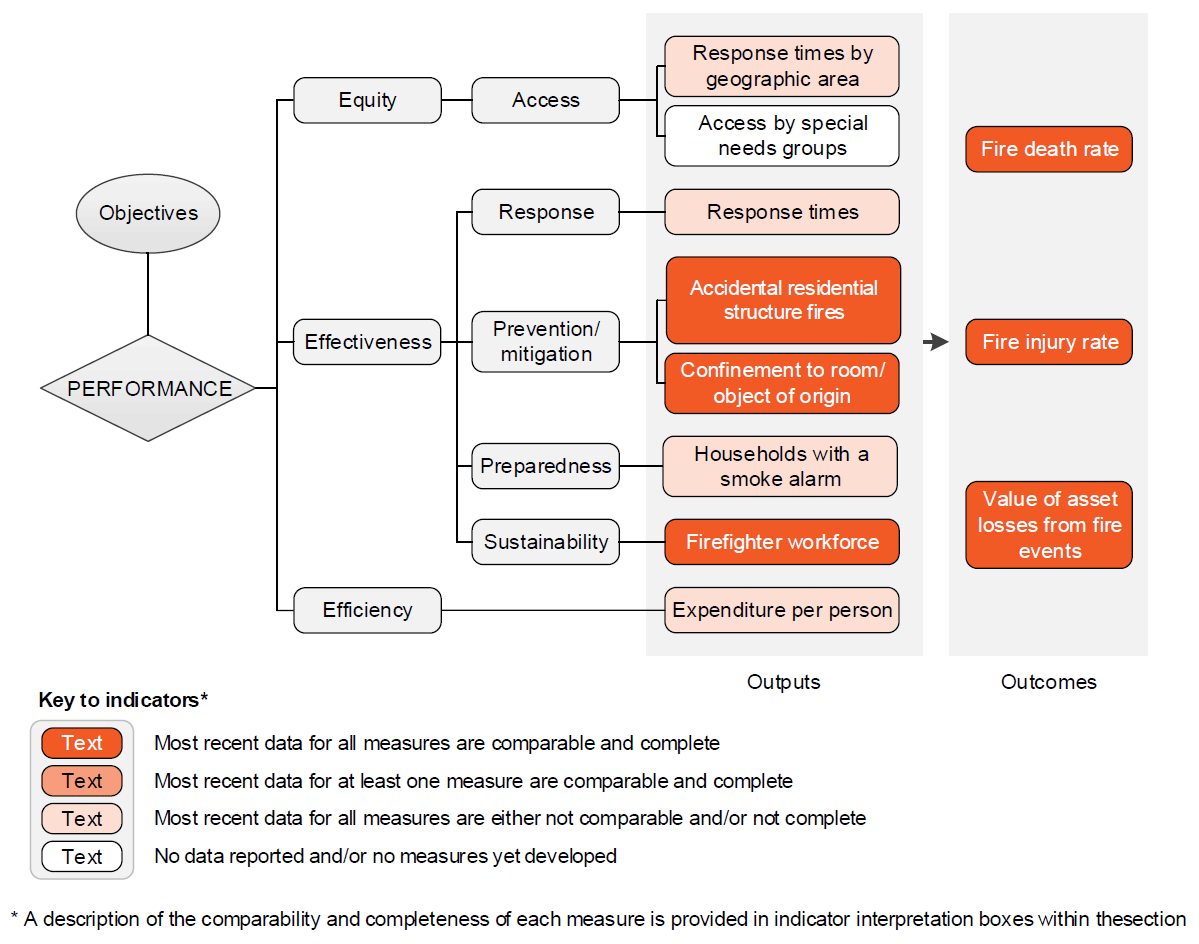
The performance indicator framework provides information on equity, efficiency and effectiveness, and distinguishes the outputs and outcomes of emergency services for fire events.
The performance indicator framework shows which data are complete and comparable in this Report. For data that are not considered directly comparable, text includes relevant caveats and supporting commentary. Section 1 discusses data comparability and completeness from a Report-wide perspective. In addition to the service area's Profile information, the Report’s statistical context (Section 2) contains data that may assist in interpreting the performance indicators presented in this section.
Improvements to performance reporting for emergency services for fire and other events are ongoing and include identifying data sources to fill gaps in reporting for performance indicators and measures, and improving the comparability and completeness of data.
Outputs
Outputs are the services delivered (while outcomes are the impact of these services on the status of an individual or group) (see section 1). Output information is also critical for equitable, efficient and effective management of government services.
Outcomes
Outcomes are the impact of services on the status of an individual or group (see section 1).
An overview of the Emergency services for fire and other events indicator results is presented. Different delivery contexts, locations and types of clients can affect the equity, effectiveness and efficiency of emergency services.
Information to assist the interpretation of these data can be found in the Emergency services interpretative material and data tables. Data tables are identified by a ‘9A’ prefix (for example, table 9A.1).
All data are available for download as an excel spreadsheet and as a CSV dataset — refer to Download supporting material. Specific data used in figures can be downloaded by clicking in the figure area, navigating to the bottom of the visualisation to the grey toolbar, clicking on the 'Download' icon and selecting 'Data' from the menu. Selecting 'PDF' or 'Powerpoint' from the 'Download' menu will download a static view of the performance indicator results.
Download supporting material
- 9 Emergency services interpretative material (PDF - 394 Kb)
- 9 Emergency services interpretative material (Word - 137 Kb)
- 9 Emergency services data tables (XLSX - 279 Kb)
- 9 Emergency services dataset (CSV - 488 Kb)
See the interpretative material and corresponding table number in the data tables for detailed definitions, caveats, footnotes and data source(s).