Report on Government Services 2021
PART E, SECTION 10: RELEASED ON 28 JANUARY 2021
10 Primary and community health
This section is presented in a new online format. Dynamic data visualisations replace the static chapter format used in previous editions. Machine readable data are also available for download. A guide is available on accessing information in the new format.
Impact of COVID-19 on data for the Primary and community health services section
COVID-19 may affect data in this Report in a number of ways. This includes in respect of actual performance (that is, the impact of COVID-19 on service delivery in 2020 which is reflected in the data results), and the collection and processing of data (that is, the ability of data providers to undertake data collection and process results for inclusion in the Report).
For the Primary and community health services section, general practice attendance and expenditure data will be impacted by changes in service use, including the increasing use of telehealth services, particularly during COVID-19 shut-downs.
This section reports on the performance of primary and community health services which include general practice, pharmaceutical services, dentistry, allied health services, community health services, maternal and child health and alcohol and other drug treatment. This section does not include:
- public hospital emergency departments and outpatient services (reported in section 12, ‘Public hospitals’)
- community mental health services (reported in section 13, ‘Services for mental health’)
- home and community care services (reported in section 14, ‘Aged care’ and section 15, ‘Services for people with disability’).
The Indicator Results tab uses data from the data tables to provide information on the performance for each indicator in the Indicator Framework. The same data are also available in CSV format.
- Context
- Indicator Framework
- Indicator Results
- Indigenous Data
Objectives for primary and community health
Primary and community health services aim to promote health, prevent illness and to support people to manage their health issues in the community, by providing services that are:
- timely, affordable and accessible to all
- appropriate and responsive to meet the needs of individuals throughout their lifespan and communities
- well coordinated to ensure continuity of care where more than one service type, and/or ongoing service provision is required
- sustainable.
Governments aim for primary and community health services to meet these objectives in an equitable and efficient manner.
Service overview
Primary and community health services are delivered by a range of health and allied health professionals in various private, not‑for‑profit and government service settings. Definitions for common health terms are provided in sub-section 10.2.
General practice
General practice is a major provider of primary healthcare in Australia. General practice services include preventative care and the diagnosis and treatment of illness and injury, through direct service provision and/or referral to acute (hospital) or other healthcare services, as appropriate.
The Australian Government provides the majority of general practice income, through Department of Human Services (DHS) Medicare — mainly as fee for service payments via the Medicare Benefits Schedule (MBS) — and the Department of Veterans’ Affairs (DVA). Additional funding is provided to influence the supply, regional distribution and quality of general practice services, through initiatives such as the Practice Incentives Program (PIP) and Primary Health Networks (PHNs) (Australian Government DHS 2015). State and Territory governments also provide some funding for such programs, mainly to influence the availability of GPs in rural and remote areas. The remainder comes primarily from insurance schemes and patient contributions.
Pharmaceutical services
The Commonwealth funds the Pharmaceutical Benefits Scheme (PBS), which subsidises the cost of many medicines in Australia. The PBS schedule sets a price for listed medicines and a maximum co-payment amount that people contribute towards the cost of these medicines. The Commonwealth incurs the expense of any difference where the listed price exceeds the patient co contribution (whether for general or concessional patients). Around 70 per cent of prescriptions for PBS-listed medicines attract a PBS subsidy (the remainder are under the general co-payment level) (Department of Health 2019). Co-payments contribute to a patient’s safety net threshold that, once reached, provides eligibility to receive PBS medicines at a lower cost or free of charge.
The Repatriation Pharmaceutical Benefits Scheme (RPBS) provides subsidised pharmaceutical medicines, dressings and other items to war veterans and war widows. The RPBS is administered by the DVA.
Dental services
Australia has a mixed system of public and private dental services. State and Territory governments deliver public dental services, which are primarily available to children and disadvantaged adults. The Australian Government works with State and Territory governments to fund dental services. Since 2013, the Australian Government has increased funding for public dental services via National Partnership Agreements with States and Territories and the Child Dental Benefits Schedule. The private sector receives funding to provide some public dental services, from the Australian Government through the DVA and the Child Dental Benefits Schedule, and from State and Territory governments through dental voucher systems. Under the COAG Health Council, Australian governments developed the National Oral Health Plan 2015 to 2024 that sets out priorities to improve dental health across Australia (COAG 2015).
Allied health services
Allied health services include, but are not limited to, physiotherapy, psychology, occupational therapy, audiology, podiatry and osteopathy. They are delivered mainly in the private sector. Some government funding of private allied health services is provided through insurance schemes and the private health insurance rebate. The Australian Government makes some allied health services available under the MBS to patients with particular needs — for example, people with chronic conditions and complex care needs. Employment data for occupational therapists and psychologists working in the public sector are presented in table 10A.23.
Community health services
Community health services generally comprise multidisciplinary teams of health and allied health professionals who provide targeted health promotion, prevention and management services. Their aim is to protect the health and wellbeing of local populations, particularly people who have or are at risk of the poorest health and/or have the greatest economic and social needs, while taking pressure off the acute care health system. Governments (including local governments) provide community health services directly or indirectly through funding of service provision by a local health service or community organisation. There is no national strategy for community health services and there is considerable variation in the services provided across jurisdictions.
State and Territory governments are responsible for most community health services. Those serving Aboriginal and Torres Strait Islander communities are mainly the responsibility of the Australian Government (State and Territory governments provide some funding).
Maternal and child health services
Maternal and child health services are funded by State and Territory governments. They provide services including: parenting support (including antenatal and postnatal programs); early childhood nursing programs; disease prevention programs (including childhood immunisations); and early intervention and treatment programs related to child development and health. Some jurisdictions also provide specialist programs through child health services, including hearing screening programs, and mothers and babies residential programs.
Alcohol and other drug treatment
Alcohol and other drug treatment activities range from a brief intervention to long term residential treatment. Types of treatment include detoxification, pharmacological treatment, counselling and rehabilitation.
Funding
In 2018-19, of the $38.7 billion government recurrent expenditure on primary and community health services, around three-quarters was funded by the Australian Government and one-quarter by State, Territory and local governments (table 10A.1). This included:
- $10.2 billion for community health services (18.0 per cent by the Australian Government and 82.0 per cent by State, Territory and local governments)
- $2.4 billion for dental services (65.5 per cent by the Australian Government and 34.5 per cent by State, Territory and local governments) (table 10A.1).
Where more recent data are available, for 2019-20, Australian Government expenditure was:
- $10.3 billion on general practice (table 10A.2)
- $8.8 billion through the PBS and RPBS on Section 85 prescription medicines filled at pharmacies (table 10A.3)
- $39.3 million on funding of PBS medicines to Aboriginal and Torres Strait Islander primary health services in remote and very remote areas (table 10A.5)
- $783.3 million on Aboriginal and Torres Strait Islander primary health services in (table 10A.7).
Size and scope
Nationally in 2019, there were 37 472 GPs — 29 854 on a Full Time Equivalent (FTE)1 basis, equating to 117.0 per 100 000 people (table 10A.8). Nationally in 2019-20, Medicare Australia was billed for around 173.2 million services (Department of Health unpublished and Department of Veterans' Affairs unpublished). Nationally, rates of GPs per person have increased over the years presented in this Report (table 10A.8), as have the rates of GP type services used per person (table 10A.9; figure 10.1).
Around 205 million services (8.0 per person) were subsidised under Section 85 of the PBS in 2019-20 — with 91.8 per cent concessional (tables 10A.10-11). A further 8.1 million services were subsidised under the RPBS.
Nationally in 2018-19, there were:
- 209 Aboriginal and Torres Strait Islander primary health services which provided 3.7 million episodes of healthcare (table 10A.13) (data by remoteness are provided in table 10A.14). Aboriginal and Torres Strait Islander health services that provided selected activities are outlined in table 10A.15 and staffing numbers are provided in table 10A.16.
- 1283 alcohol and other drug treatment agencies (31.3 per cent identified as government providers) with a reported 219 933 closed treatment episodes (29.0 per cent identified as government provided) (table 10A.12).
The most recent available data on public dental service usage are for 2013 and showed that nationally, around 97.8 per 1000 people accessed public dental services that year (AIHW unpublished).
- See sub-section 10.2 for a definition of FTE. Locate footnote 1 above
References
Australian Government DHS (Department of Human Services) 2015, Practice Incentives Program (PIP) , http://www.humanservices.gov.au/health professionals/services/ practice incentives programme/ (accessed 16 November 2015).
AIHW (unpublished) National Dental Telephone Interview Survey.
COAG Health Council 2015, Healthy Mouths, Healthy Lives: Australia’s National Oral Health Plan 2015–2024 , http://www.coaghealthcouncil.gov.au/Portals/0/Australia%27s%20National%20Oral%20Health%20Plan%202015-2024_uploaded%20170216.pdf (accessed 11 November 2020).
Department of Health 2019, PBS expenditure and prescriptions 2018-19 , https://www.pbs.gov.au/statistics/expenditure-prescriptions/2018-2019/PBS_Expenditure_and_Prescriptions_Report_1-July-2018_to_30-June-2019.pdf (accessed 4 October 2020).
—— unpublished, MBS Statistics.
Department of Veterans Affairs (unpublished) DVA Collection.
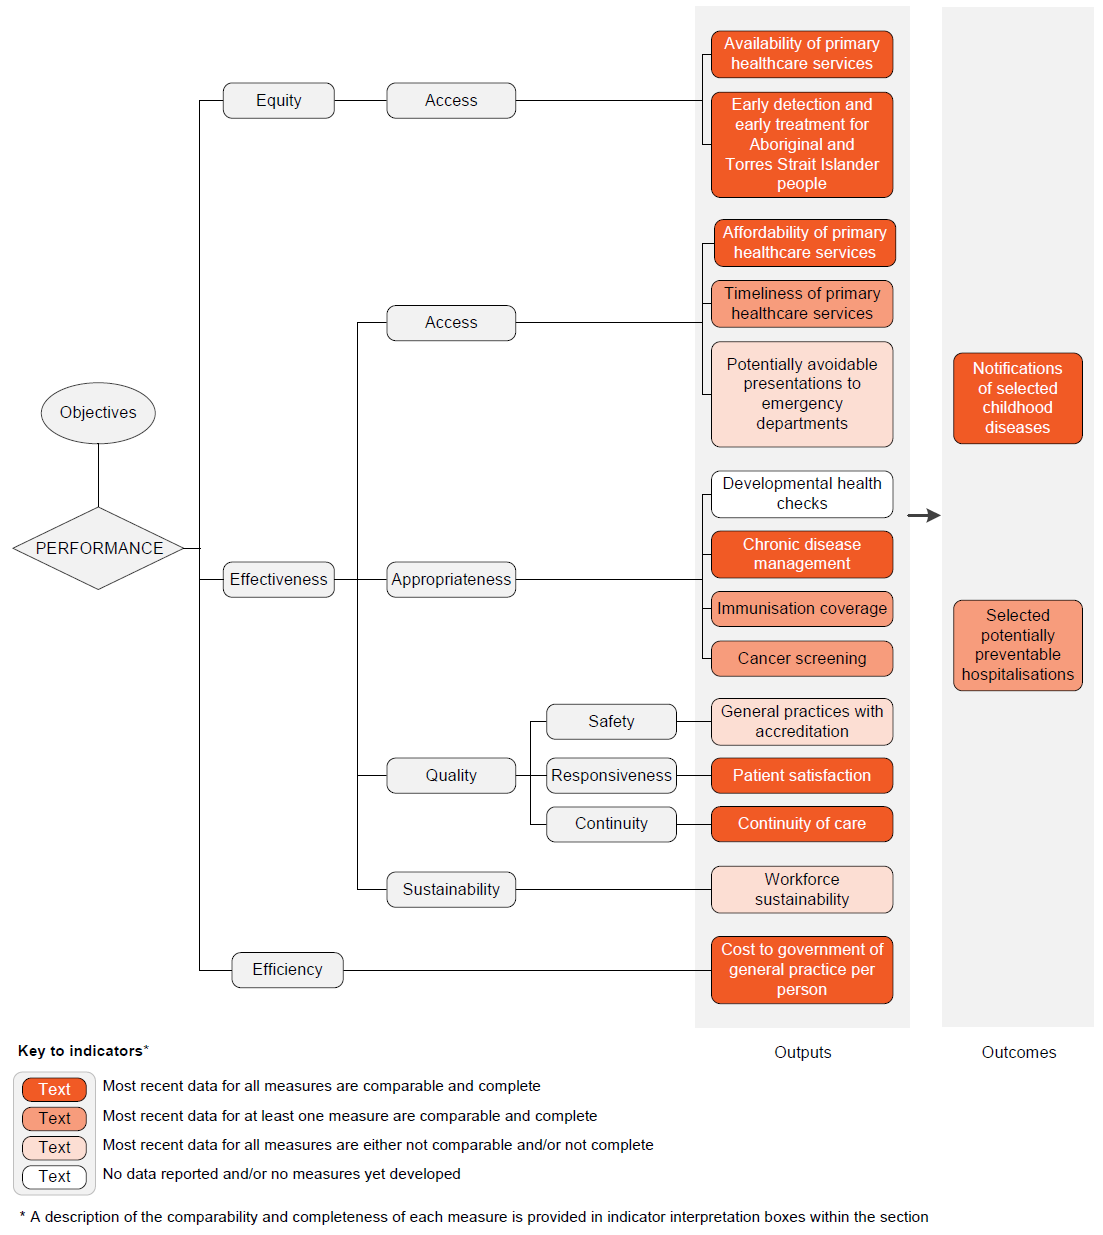
The performance indicator framework provides information on equity, efficiency and effectiveness, and distinguishes the outputs and outcomes of primary and community health services.
The performance indicator framework shows which data are complete and comparable in this Report. For data that are not considered directly comparable, text includes relevant caveats and supporting commentary. Section 1 discusses data comparability and completeness from a Report-wide perspective. In addition to the service area's Profile information, the Report’s statistical context (section 2) contains data that may assist in interpreting the performance indicators presented in this section.
Improvements to performance reporting for primary and community health services are ongoing and include identifying data sources to fill gaps in reporting for performance indicators and measures, and improving the comparability and completeness of data.
Outputs
Outputs are the services delivered (while outcomes are the impact of these services on the status of an individual or group) (see section 1). Output information is also critical for equitable, efficient and effective management of government services.
Outcomes
Outcomes are the impact of services on the status of an individual or group (see section 1).
An overview of the primary and community health services performance indicator results are presented. Different delivery contexts, locations and types of clients can affect the equity, effectiveness and efficiency of primary and community health services.
Information to assist the interpretation of these data can be found in the primary and community health services supporting interpretative material and data tables. Data tables are identified by a ‘10A’ prefix (for example, table 10A.1).
All data are available for download as an excel spreadsheet and as a CSV dataset — refer to Download supporting material. Specific data used in figures can be downloaded by clicking in the figure area, navigating to the bottom of the visualisation to the grey toolbar, clicking on the 'Download' icon and selecting 'Data' from the menu. Selecting 'PDF' or 'Powerpoint' from the 'Download' menu will download a static view of the performance indicator results.
Performance indicator data for Aboriginal and Torres Strait Islander people in this section are available in the data tables listed below. Contextual data and further supporting information can be found in the section.
| Table number | Table title |
|---|---|
| Table 10A.17 | Approved providers of PBS medicines by PhARIA area at 30 June |
| Table 10A.18 | Approved providers of PBS medicines by geolocation, at 30 June |
| Table 10A.24 | Annual health assessments for older people by Indigenous status (per cent) |
| Table 10A.25 | Aboriginal and Torres Strait Islander people who received a health check or assessment, by age (per cent) |
| Table 10A.33 | Median waiting time for public dental care, NSW (days) |
| Table 10A.34 | Median waiting time for public dental care, Victoria (days) |
| Table 10A.35 | Median waiting time for public dental care, Queensland (days) |
| Table 10A.36 | Median waiting time for public dental care, WA (days) |
| Table 10A.37 | Median waiting time for public dental care, SA (days) |
| Table 10A.38 | Median waiting time for public dental care, Tasmania (days) |
| Table 10A.39 | Median waiting time for public dental care, ACT (days) |
| Table 10A.40 | Median waiting time for public dental care, NT (days) |
| Table 10A.50 | Participation rates for Aboriginal and Torres Strait Islander women screened by BreastScreen Australia (24 month period) (first and subsequent rounds) (per cent) |
| Table 10A.65 | Separations for selected potentially preventable hospitalisations by Indigenous status (per 1000 people) |
| Table 10A.67 | Separations for selected potentially preventable hospitalisations by Indigenous status and remoteness, Australia (per 1000 people) |
| Table 10A.68 | Separations for selected vaccine preventable conditions by Indigenous status (per 1000 people) |
| Table 10A.69 | Separations for selected acute conditions by Indigenous status (per 1000 people) |
| Table 10A.70 | Separations for selected chronic conditions by Indigenous status (per 1000 people) |
| Table 10A.71 | Ratio of separations for Aboriginal and Torres Strait Islander people to all Australians, diabetes |
Download supporting material
- 10 Primary and community health interpretative material (PDF - 508 Kb)
- 10 Primary and community health interpretative material (Word - 59 Kb)
- 10 Primary and community health data tables (XLSX - 976 Kb)
- 10 Primary and community health dataset (CSV - 1935 Kb)
See the interpretative material and corresponding table number in the data tables for detailed definitions, caveats, footnotes and data source(s).