Report on Government Services 2022
PART E, SECTION 10: RELEASED ON 1 FEBRUARY 2022
10 Primary and community health
Impact of COVID-19 on data for the Primary and community health services section
COVID-19 may affect data in this Report in a number of ways. This includes in respect of actual performance (that is, the impact of COVID-19 on service delivery during 2020 and 2021 which is reflected in the data results), and the collection and processing of data (that is, the ability of data providers to undertake data collection and process results for inclusion in the Report).
For the Primary and community health services section, the actual and potential impacts from COVID-19 included:
- an increase in the use of telehealth services by general practitioners, specialists and allied health professionals following the introduction of new telehealth MBS items in March 2020
- temporary increases in incentives to encourage bulk billing of some services, which were introduced between March 2020 and October 2020
- impacts on the PBS with: (1) a large increase in prescriptions dispensed in March 2020, particularly for medicines used to treat respiratory related conditions such as asthma and chronic obstructive pulmonary disease (this was potentially the result of patient purchasing behaviours following the introduction of COVID-19 restrictions), and (2) a decrease in prescriptions dispensed for antibiotics and antivirals during 2020 (likely associated with COVID-19 measures such as physical distancing and improved hand hygiene practices leading to a lower incidence of some infectious diseases)
- a decline in breast cancer screening in 2019-2020 as BreastScreen Australia services temporarily closed, or operated at a reduced capacity, to minimise the risk of COVID-19 for patients and staff.
This section reports on the performance of primary and community health services which include general practice, pharmaceutical services, dentistry, allied health services, community health services, maternal and child health and alcohol and other drug treatment. This section does not include:
- public hospital emergency departments and outpatient services (reported in section 12, ‘Public hospitals’)
- community mental health services (reported in section 13, ‘Services for mental health’)
- home and community care services (reported in section 14, ‘Aged care’ and section 15, ‘Services for people with disability’).
The Indicator Results tab uses data from the data tables to provide information on the performance for each indicator in the Indicator Framework. The same data are also available in CSV format.
- Context
- Indicator framework
- Indicator results
- Indigenous data
- Key terms and references
Objectives for primary and community health
Primary and community health services aim to promote health, prevent illness and to support people to manage their health issues in the community, by providing services that are:
- timely, affordable and accessible to all
- appropriate and responsive to meet the needs of individuals throughout their lifespan and communities
- well coordinated to ensure continuity of care where more than one service type, and/or ongoing service provision is required
- sustainable.
Governments aim for primary and community health services to meet these objectives in an equitable and efficient manner.
Service overview
Primary and community health services are delivered by a range of health and allied health professionals in various private, not‑for‑profit and government service settings. Definitions for common health terms are provided in the 'Key terms and references' tab.
General practice
General practice is a major provider of primary healthcare in Australia. General practice services include preventative care and the diagnosis and treatment of illness and injury, through direct service provision and/or referral to acute (hospital) or other healthcare services, as appropriate.
The Australian Government provides the majority of general practice income, through Department of Human Services (DHS) Medicare — mainly as fee for service payments via the Medicare Benefits Schedule (MBS) — and the Department of Veterans’ Affairs (DVA). Additional funding is provided to influence the supply, regional distribution and quality of general practice services, and support engagement of the health workforce in primary health care settings, through initiatives such as the Practice Incentives Program (PIP), the Workforce Incentive Program (WIP), and Primary Health Networks (PHNs) (Services Australia 2021). State and Territory governments also provide some funding for such programs, mainly to influence the availability of GPs in rural and remote areas. The remainder comes primarily from insurance schemes and patient contributions.
Pharmaceutical services
The Commonwealth funds the Pharmaceutical Benefits Scheme (PBS), which subsidises the cost of many medicines in Australia. The PBS schedule sets a price for listed medicines and a maximum co-payment amount that people contribute towards the cost of these medicines. The Commonwealth incurs the expense of any difference where the listed price exceeds the patient co contribution (whether for general or concessional patients). Around 70 per cent of prescriptions for PBS-listed medicines attract a PBS subsidy (the remainder are under the general co-payment level) (Department of Health 2020). Co-payments contribute to a patient’s safety net threshold that, once reached, provides eligibility to receive PBS medicines at a lower cost or free of charge.
The Repatriation Pharmaceutical Benefits Scheme (RPBS) provides subsidised pharmaceutical medicines, dressings and other items to war veterans and war widows. The RPBS is administered by the DVA.
Dental services
Australia has a mixed system of public and private dental services. State and Territory governments deliver public dental services, which are primarily available to children and disadvantaged adults. The Australian Government works with State and Territory governments to fund dental services. Since 2013, the Australian Government has increased funding for public dental services via National Partnership Agreements with States and Territories and the Child Dental Benefits Schedule. The private sector receives funding to provide some public dental services, from the Australian Government through the DVA and the Child Dental Benefits Schedule, and from State and Territory governments through dental voucher systems. Under the COAG Health Council, Australian governments developed the National Oral Health Plan 2015 to 2024 that sets out priorities to improve dental health across Australia (COAG 2015). Data on dental service expenditure in 2019-20 are presented in table 10A.6.
Allied health services
Allied health services include, but are not limited to, physiotherapy, psychology, occupational therapy, podiatry and osteopathy. They are delivered mainly in the private sector. Some government funding of private allied health services is provided through insurance schemes and the private health insurance rebate. The Australian Government makes some allied health services available under the MBS to patients with particular needs — for example, people with chronic conditions and complex care needs. The Australian Government also funds the Workforce Incentive Program (WIP) – Practice Steam, which supports general practices, Aboriginal Medical Services and Aboriginal Community Controlled Health Services with the cost of engaging eligible allied health professionals. Data on the number of Medicare rebated allied health services used per person and the availability of public allied health professionals by region are presented in tables 10A.10 and 10A.22, respectively.
Community health services
Community health services generally comprise multidisciplinary teams of health and allied health professionals who provide targeted health promotion, prevention and management services. Their aim is to protect the health and wellbeing of local populations, particularly people who have or are at risk of the poorest health and/or have the greatest economic and social needs, while taking pressure off the acute care health system. Governments (including local governments) provide community health services directly or indirectly through funding of service provision by a local health service or community organisation. There is no national strategy for community health services and there is considerable variation in the services provided across jurisdictions.
State and Territory governments are responsible for most community health services. Those serving Aboriginal and Torres Strait Islander communities are mainly the responsibility of the Australian Government (State and Territory governments provide some funding).
Maternal and child health services
Maternal and child health services are funded by State and Territory governments. They provide services including: parenting support (including antenatal and postnatal programs); early childhood nursing programs; disease prevention programs (including childhood immunisations); and early intervention and treatment programs related to child development and health. Some jurisdictions also provide specialist programs through child health services, including hearing screening programs, and mothers and babies residential programs.
Alcohol and other drug treatment
Alcohol and other drug treatment activities range from a brief intervention to long term residential treatment. Types of treatment include detoxification, pharmacological treatment, counselling and rehabilitation. Selected data on these services are available in table 10A.13.
Funding
In 2019-20, of the $41.1 billion government recurrent expenditure on primary and community health services, around three-quarters was funded by the Australian Government and one-quarter by State, Territory and local governments (table 10A.1). This included:
- $9.7 billion for community health services (14.7 per cent by the Australian Government and 85.3 per cent by State, Territory and local governments)
- $2.1 billion for dental services (58.8 per cent by the Australian Government and 41.2 per cent by State, Territory and local governments) (table 10A.1).
Where more recent data are available, for 2020-21, Australian Government expenditure was:
- $11.2 billion on general practice (table 10A.2)
- $9.4 billion through the PBS and RPBS on Section 85 prescription medicines filled at pharmacies (table 10A.3)
- $43.7 million on funding of PBS medicines to Aboriginal and Torres Strait Islander primary health services in remote and very remote areas (table 10A.5)
- $797.8 million on Aboriginal and Torres Strait Islander primary health services in (table 10A.7).
Size and scope
Nationally in 2020, there were 37 785 GPs — 29 419 on a Full Time Equivalent (FTE)1 basis, equating to 114.5 per 100 000 people (table 10A.8). Nationally in 2020-21, Medicare Australia was billed for around 180.8 million services (Department of Health unpublished and Department of Veterans' Affairs unpublished). Nationally, rates of GPs per person increased each year between 2014 and 2019, before declining in 2020 (table 10A.8). Nationally, rates of
GP-type services used per person increased between 2015-16 and 2020-21 (table 10A.9; figure 10.1).
Around 210 million services (8.2 per person) were subsidised under Section 85 of the PBS in 2020-21 — with
91.9 per cent concessional. A further 7.6 million services were subsidised under the RPBS (tables 10A.11-12).
Nationally in 2019-20 there were:
- 196 Aboriginal and Torres Strait Islander primary health services which provided 3.5 million episodes of healthcare (table 10A.14) (data by remoteness are provided in table 10A.15). Staffing numbers are provided in table 10A.17.
- 1258 alcohol and other drug treatment agencies (33.0 per cent identified as government providers) with a reported 237 545 closed treatment episodes (26.6 per cent identified as government provided) (table 10A.13).
The most recent available data on public dental service usage are for 2013 and showed that nationally, around 97.8 per 1000 people accessed public dental services that year (AIHW unpublished).
- See 'Key terms and references' tab for a definition of FTE. Locate footnote 1 above
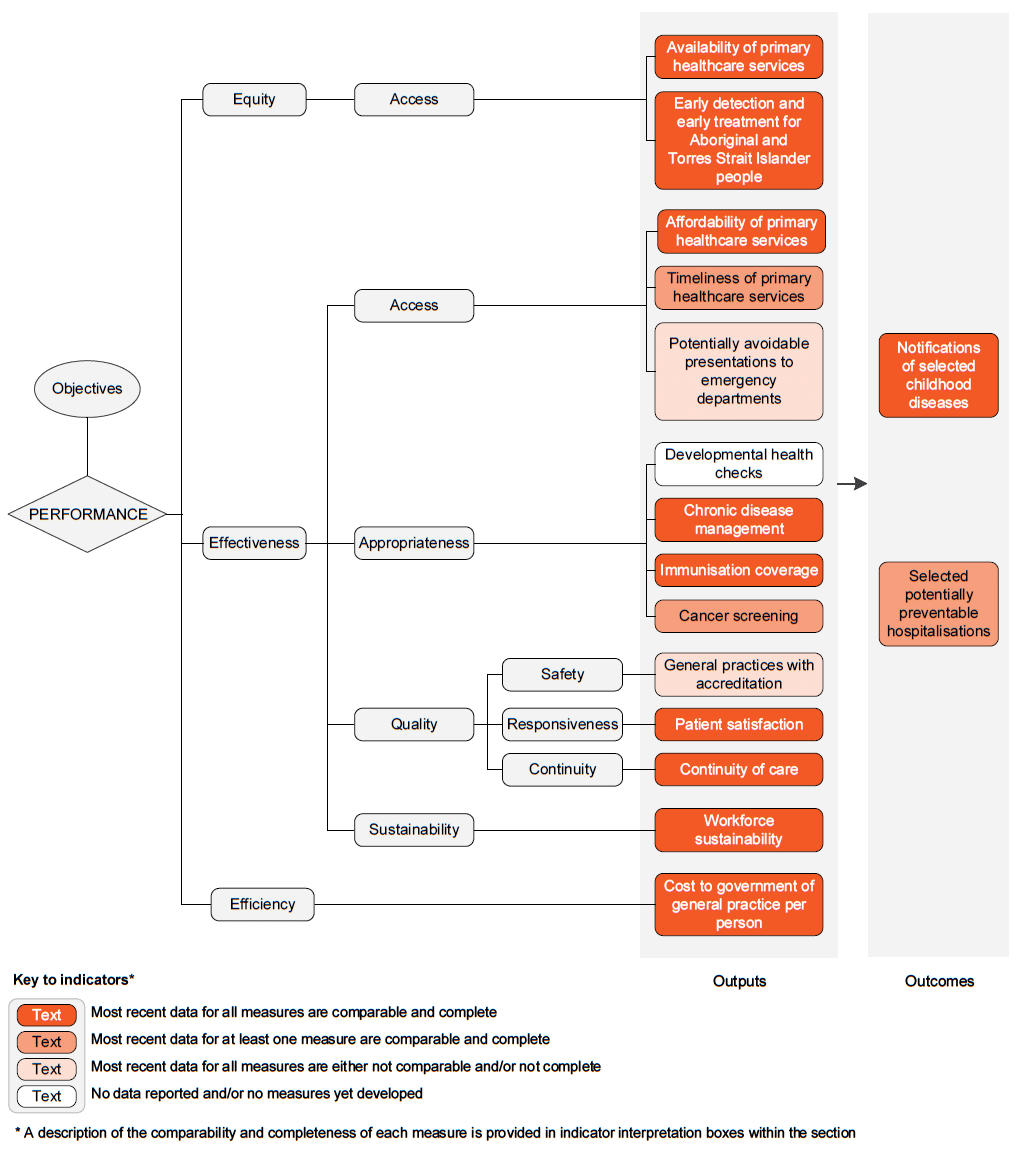
The performance indicator framework provides information on equity, efficiency and effectiveness, and distinguishes the outputs and outcomes of primary and community health services.
The performance indicator framework shows which data are complete and comparable in this Report. For data that are not considered directly comparable, text includes relevant caveats and supporting commentary. Section 1 discusses data comparability and completeness from a Report-wide perspective. In addition to the contextual information for this service area (see Context tab), the Report’s statistical context (section 2) contains data that may assist in interpreting the performance indicators presented in this section.
Improvements to performance reporting for primary and community health services are ongoing and include identifying data sources to fill gaps in reporting for performance indicators and measures, and improving the comparability and completeness of data.
Outputs
Outputs are the services delivered (while outcomes are the impact of these services on the status of an individual or group) (see section 1). Output information is also critical for equitable, efficient and effective management of government services.
Outcomes
Outcomes are the impact of services on the status of an individual or group (see section 1).
An overview of the Primary and community health services performance indicator results are presented. Different delivery contexts, locations and types of clients can affect the equity, effectiveness and efficiency of primary and community health services.
Information to assist the interpretation of these data can be found with the indicators below and all data (footnotes and data sources) are available for download from Download supporting material. Data tables are identified by a ‘10A’ prefix (for example, table 10A.1).
All data are available for download as an excel spreadsheet and as a CSV dataset — refer to Download supporting material. Specific data used in figures can be downloaded by clicking in the figure area, navigating to the bottom of the visualisation to the grey toolbar, clicking on the 'Download' icon and selecting 'Data' from the menu. Selecting 'PDF' or 'Powerpoint' from the 'Download' menu will download a static view of the performance indicator results.
1. Availability of primary healthcare services
‘Availability of primary healthcare services’ is an indicator of governments’ objective to provide access to primary healthcare services in an equitable manner.
‘Availability of primary healthcare services’ is defined by four measures:
- PBS medicines by region, defined as the ABS census population divided by the number of approved providers of PBS medicines, by urban/rural location and Pharmacy Access/Remoteness Index of Australia (PhARIA) area
- General Practitioners (GPs) by region, defined as the number of FTE GPs per 100 000 people, by region
- GPs by sex, defined as the number of FTE GPs per 100 000 population, by sex
- Public dentists by region, defined as the number of full time equivalent (FTE) public dentists per 100 000 people based on clinical hours worked in the public sector, by region.
Similar rates across regions indicates equity of access by location. Similar rates by sex means it is more likely that patients who prefer to visit GPs of their own sex will have their preference met. Low availability of GPs of each sex can be associated with increased waiting times to see a GP, for patients who prefer to visit GPs of their own sex.
Measures on GPs by region and sex, and Public dentists by region do not provide information on whether people are accessing services or whether the services are appropriate for the needs of the people receiving them.
Nationally, at 30 June 2021, there were 4068 people per approved PBS provider in urban areas and 2924 people per approved PBS provider in rural areas (figure 10.2a). These numbers have decreased in urban and rural areas following a peak in 2017 (table 10A.18). Data are also available for pharmacy providers only (table 10A.18) and by PhARIA (table 10A.17).
Nationally in 2020, the number of FTE GPs per 100 000 people decreased as remoteness increased, and there were 91.9 FTE female GPs per 100 000 females and 137.5 FTE male GPs per 100 000 males (figure 10.2b).
Nationally in 2020, the rate of FTE public dentists per 100 000 people was higher in remote/very remote areas (9.5 per 100 000 people) compared to other areas (5.2–5.8 per
100 000 people) (figure 10.2c). Data on FTE public dentists and allied dental practitioners are presented in table 10A.22.
2. Early detection and early treatment for Aboriginal and Torres Strait Islander people
‘Early detection and early treatment for Aboriginal and Torres Strait Islander people’ is an indicator of governments’ objective to provide access to primary and community healthcare in an equitable manner.
‘Early detection and early treatment for Aboriginal and Torres Strait Islander people’ is defined as the proportion of older people who received a health assessment under Medicare by Indigenous status.
Older people are defined as Aboriginal and Torres Strait Islander people aged 55 years or over and non-Indigenous people aged 75 years or over, excluding hospital inpatients and people living in aged care facilities. Health assessments are Medicare Benefits Schedule (MBS) items that allow comprehensive examinations of patient health, including physical, psychological and social functioning.
A small or narrowing gap between the proportion of Aboriginal and Torres Strait Islander people and non-Indigenous people who received a health assessment can indicate more equitable access to early detection and early treatment services for Aboriginal and Torres Strait Islander people. An increase over time in the proportion of older Aboriginal and Torres Strait Islander people who received a health assessment is desirable as it indicates improved access to these services.
This indicator provides no information about health assessments provided outside Medicare (predominantly used by Aboriginal and Torres Strait Islander people in remote and very remote areas). Accordingly, this indicator understates the proportion of Aboriginal and Torres Strait Islander people who received early detection and early treatment services.
Nationally in 2020-21, the proportion of older people receiving a health assessment was 38.1 per cent for Aboriginal and Torres Strait Islander people and 31.0 per cent for non-Indigenous people (figure 10.3a).
Nationally, over the ten years to 2020-21, the proportion of older Aboriginal and Torres Strait Islander people who received an annual health assessment increased by 18.0 percentage points to 38.1 per cent, compared to an increase of 3.2 percentage points to 31.0 per cent for older non-Indigenous people (with the proportion higher for Aboriginal and Torres Strait Islander older people from 2015-16).
For Aboriginal and Torres Strait Islander people by age, the proportion who received an annual health assessment is higher for those aged 55 years or over (38.1 per cent) compared to those aged 15–54 years and 0–14 years
(25.6 per cent for both age cohorts). Proportions increased for all age groups over the 10 years of data in this Report (figure 10.3b and table 10A. 24).
3. Affordability of primary healthcare services
‘Affordability of primary healthcare services’ is an indicator of governments’ objective to provide primary healthcare services that are affordable.
‘Affordability of primary healthcare’ is defined by two measures:
- People delaying or not seeing GPs due to cost, defined as the proportion of people who delayed seeing or did not see a GP when needed at any time in the previous 12 months due to cost.
- People delaying or not filling prescriptions due to cost, defined as the proportion of people who delayed filling or did not fill a prescription when needed at any time in the previous 12 months due to cost.
A low or decreasing proportion of people deferring visits to GPs or filling prescriptions due to cost indicates more widely affordable access to GPs and medicines.
Data are sourced from the ABS Patient Experience Survey (PExS) of people aged 15 years and over.The PExS does not include people living in discrete Indigenous communities, which affects the representativeness of the NT results. Approximately 20 per cent of the resident population of the NT live in discrete Indigenous communities.
Nationally in 2020-21, 2.4 per cent of respondents who needed to see a GP reported that they delayed or did not see a GP in the last 12 months due to cost (figure 10.4a).
Contextual information on bulk billing and out-of-pocket costs are provided to assist interpretation of this indicator. Bulk billing information is available for both patients and services (one patient may have more than one service in a given year). Bulk billing rates for non-referred GP and specialist services, by jurisdiction, region and age are available in tables 10A.26-29. Nationally in 2020-21, 88.8 per cent of non-referred GP services and 35.1 per cent of specialist services were bulk billed. Information on the proportion of non-referred GP patients who were fully bulk billed are available in table 10A.30. Nationally in 2020-21, 67.6 per cent of patients were fully bulk billed, continuing an annual increase over the 10 year period of available data. Data on average patient out-of-pocket costs are reported in table 10A.31. Nationally in 2020-21, out-of-pocket costs were highest for specialists ($93), followed by allied health services ($55) and non-referred GPs ($41).
Nationally in 2020-21, 4.4 per cent of respondents who needed a prescription for medication reported that they delayed filling or did not fill a prescription in the last 12 months due to cost (figure 10.4b).
The proportions for both measures continue the downward trend for the nine years of available data, and are significantly lower in 2020-21 compared to the previous year (figures 10.4a and 10.4b).
4. Timeliness of primary healthcare services
‘Timeliness of primary healthcare services’ is an indicator of governments’ objective to ensure primary healthcare services are provided in a timely manner.
‘Timeliness of primary healthcare services’ is defined by two measures:
- Public dentistry waiting times, defined as the number of days waited at the 50th (median) and 90th percentiles between being placed on a selected public dentistry waiting list and either being offered dental care or receiving dental care
- GP waiting times for urgent medical care, defined as the proportion of people who, in the previous 12 months, saw a GP for urgent medical care within specified times from making the appointment. Specified waiting times are: less than 4 hours; 4 to less than 24 hours; 24 hours or more.
A shorter time waited to see a dental professional indicates more timely access to public dental services. A high or increasing proportion of people who saw a GP within 4 hours for urgent medical care indicates more timely access to GPs.
Public dental waiting times only include records on persons eligible for public dental services who were aged
18 years or over. It excludes those on jurisdictional priority client schemes and those who access the service but pay full price. Data are reported by Aboriginal and Torres Strait Islander status, remoteness area of residence, and Socio-Economic Indexes for Areas (SEIFA) of residence.
The ABS Patient Experience Survey of people aged 15 years and over does not include people living in discrete Indigenous communities, which affects the representativeness of the NT results for the GP waiting times measure. Approximately 20 per cent of the estimated resident population of the NT live in discrete Indigenous communities.
Data for the time waited at the 50th and 90th percentiles by people on selected public dental waiting lists are presented for states and territories (figure 10.5a).
Nationally in 2020-21, for people who saw a GP for urgent care:
- 55.8 per cent waited less than 4 hours, down from 59.4 per cent in 2019-20 (figure 10.5b)
- 10.5 per cent waited from 4 to less than 24 hours
- 33.9 per cent waited for 24 hours or more, up from 29.8 per cent in 2019-20 (table 10A.42).
Overall, 16.6 per cent of people who saw a GP for their own health waited longer than they felt was acceptable to get an appointment (table 10A.43).
5. Potentially avoidable presentations to emergency departments
‘Potentially avoidable presentations to emergency departments’ (also known as ‘GP-type presentations’) is an indicator of governments’ objective for primary and community healthcare to be accessible.
Potentially avoidable presentations to emergency departments (interim measure) are defined as the number of selected ‘GP‑type presentations’ to emergency departments, where selected GP‑type presentations are emergency presentations:
- allocated to triage category 4 (semi‑urgent) or 5 (non‑urgent); and
- not arriving by ambulance, with police or corrections; and
- not admitted or referred to another hospital; and
- who did not die.
Potentially avoidable presentations to emergency departments are presentations for conditions that could be appropriately managed in the primary and community health sector. In some cases, this can be determined only retrospectively and presentation to an emergency department is appropriate. Factors contributing to GP‑type presentations at emergency departments include perceived or actual lack of access to GP services, the proximity of emergency departments and trust in emergency department staff.
Once a suitable denominator for this measure is agreed, a low or decreasing rate/proportion of potentially avoidable presentations to emergency departments can indicate better access to primary and community health care. Currently, the number of potentially avoidable presentations to emergency departments are reported for this indicator. In future, this indicator will be reported as a proportion (for example, the number of potentially avoidable GP-type presentations to emergency departments, as a proportion of all presentations to emergency departments), subject to the identification of a suitable denominator.
Nationally in 2020-21, there were around 3.2 million GP type presentations to public hospital emergency departments, an increase of 12 per cent from 2019-20 (table 10.1). Results varied across jurisdictions.
6. Developmental health checks
‘Developmental health checks’ is an indicator of governments’ objective to ensure that services are appropriate and responsive to the needs of children.
‘Developmental health checks’ are defined as the proportion of preschool-aged children who received a developmental health assessment.
A high or increasing proportion of preschool-aged children receiving developmental health checks is desirable.
Data are not yet available for reporting against this indicator.
7. Chronic disease management
‘Chronic disease management’ is an indicator of governments’ objective to ensure that primary and community health services are appropriate and responsive to meet the needs of individuals throughout their lifespan.
‘Chronic disease management’ is defined by two measures:
- Management of diabetes, defined as the proportion of people with diabetes with HbA1c (glycosylated haemoglobin) levels less than or equal to 7 per cent
- Management of asthma, defined as the proportion of people with asthma who have a written asthma action plan.
A high or increasing proportion for each measure is desirable. HbA1c provides a measure of the average blood glucose level for the preceding three months, and a HbA1c level less than or equal to 7 per cent indicates appropriate management. HbA1c data are for people aged 18-69 years.
The ABS National Health Survey does not include people living in very remote areas and discrete Indigenous communities, which affects the representativeness of the NT results for the asthma measure. Approximately 20 per cent of the estimated resident population of the NT live in very remote areas and discrete Indigenous communities.
Nationally in 2011-12, 50.5 per cent of people with known diabetes had a HbA1c level at or below 7 per cent (figure 10.6a), but of this group, only 77.5 per cent had a HbA1c test in the previous 12 months (table 10A.45).
Nationally in 2017-18, the age-standardised proportion of people with asthma reporting that they have a written asthma action plan was 32.3 per cent (figure 10.6b), compared to 28.4 per cent in 2014-15. In all jurisdictions, the proportion was higher for children aged 0–14 years than for other age groups (table 10A.46).
8. Immunisation coverage
‘Immunisation coverage’ is an indicator of governments’ objective to ensure primary and community health services are appropriate and responsive to meet the needs of individuals throughout their lifespan and communities.
‘Immunisation coverage’ is defined by four measures:
- Proportion of children aged 12<15 months who are fully immunised (at this age, against diphtheria, tetanus, pertussis (whooping cough), polio, hepatitis b, Haemophilus influenzae type b and pneumococcal)
- Proportion of children aged 24<27 months who are fully immunised (at this age, against diphtheria, tetanus, pertussis (whooping cough), polio, Haemophilus influenzae type b, hepatitis B, measles, mumps and rubella (MMR), meningococcal C and varicella)
- Proportion of children aged 60<63 months who are fully immunised (at this age, against diphtheria, tetanus, pertussis (whooping cough), polio, and to the quarter ending 31 December 2017, including measles, mumps and rubella (MMR))
- Proportion of people aged 65 years and over who have been vaccinated against seasonal influenza.
High or increasing proportions of people immunised are desirable
Nationally, the proportion of children fully immunised in 2020-21 was: 94.9 per cent for children aged 12 to less than 15 months; 92.6 per cent for children aged 24 to less than 27 months; and 95.2 per cent for children aged 60 to less than 63 months (figure 10.7a). Contextual data on vaccinations supplied to children under 7 years of age, by type of provider are in table 10A.47.
Nationally, in 2020-21, 60.3 per cent of people aged 65 years and over were vaccinated against seasonal influenza, with the proportion lower for Aboriginal and Torres Strait Islander people (59.2 per cent) compared to non-Indigenous people (60.4 per cent) (table 10.2).
9. Cancer screening
‘Cancer screening’ is an indicator of governments’ objective to ensure primary and community health services are appropriate and responsive to meet the needs of individuals throughout their lifespan and communities.
‘Cancer screening’ is defined by three measures:
- Participation for women in breast cancer screening, defined as the proportion of women aged 50–74 years who are screened in the BreastScreen Australia Program over a 24‑month period, reported as a rate
- Participation for women in cervical screening, defined as the proportion of the estimated eligible population of women (that is, women who had not had a hysterectomy) aged 25–74 years who are screened over a 5-year period, reported as a rate
- A new National Cervical Screening Program commenced in December 2017, at which time cervical screening changed from 2-yearly pap tests to 5-yearly cervical screening tests. As such, national reporting on cervical screening participation rates is in a period of transition. Under the new National Cervical Screening Program, program participation rates cannot be calculated until 5 years of data are available from program commencement.
- Participation of persons in bowel cancer screening, defined as persons aged 50–74 years who were invited to participate in the National Bowel Cancer Screening Program over a 24‑month period and returned a completed test kit within 6 months of the end of that period, divided by the number of invitations issued minus those people who opted out or suspended without completing their screening test.
High or increasing participation rates are desirable.
The national age-standardised BreastScreen participation rate for women aged 50–74 years for 2019–2020 was 49.4 per cent (figure 10.8a), a decrease on 2018-2019 (54.2 per cent). For 2019–2020, the participation rate for Aboriginal and Torres Strait Islander women aged 50–74 years was 35.7 per cent (table 10A.51).
Participation rates in cervical cancer screening for 2018-2020 suggest a national age-standardised participation rate of 55.9 per cent of women aged 25–74 years (table 10.3). Data collected under the previous screening program (to June 2017) are available in table 10A.52.
For 2019–2020, the national participation rate for persons aged 50–74 years in bowel cancer screening was 41.6 per cent, a decrease from 43.5 per cent in 2018–2019 (figure 10.8b).
10. General practices with accreditation
‘General practices with accreditation’ is an indicator of governments’ objective to ensure primary and community health services are high quality and safe.
‘General practices with accreditation’ is defined as the number of general practices in Australia that are accredited as a rate per 100 general practices. Accreditation is a voluntary process of independent third‑party peer review that assesses general practices against a set of standards developed by the Royal Australasian College of General Practitioners.
A high or increasing rate of practices with accreditation can indicate an improvement in the capability of general practice to deliver high quality services. However, general practices without accreditation may deliver services of equally high quality. For a particular general practice, the decision to seek accreditation might be influenced by perceived costs and benefits unrelated to its quality standards.
Nationally in 2019, 83.8 general practices were accredited per 100 general practices (figure 10.9).
While rates are not available for 2020 or 2021 as the total number of general practices (denominator) was not available, the number of accredited general practices at 30 June 2021 was 6500, down from 6892 at 30 June 2020 (table 10A.54). A method for sourcing the total number of general practices is under development by the Australian Government and data are anticipated to be available for the 2023 Report.
11. Patient satisfaction
‘Patient satisfaction’ is an indicator of governments’ objective that primary and community health services are high quality.
‘Patient satisfaction’ is defined as the quality of care as perceived by the patient. It is measured as patient experience of aspects of care that are key factors in patient outcomes and can be readily modified. Six measures of patient experience of communication with health professionals — a key aspect of care — are reported:
- the proportion of people who needed to and saw a GP in the previous 12 months who reported the GP always or often:
- listened carefully to them
- showed respect
- spent enough time with them
- the proportion of people who needed to and saw a dental professional in the previous 12 months who reported the dental professional always or often:
- listened carefully to them
- showed respect
- spent enough time with them.
High or increasing proportions can indicate improved satisfaction from the patient’s perspective with the quality of care.
The ABS Patient Experience Survey of people aged 15 years and over does not include people living in discrete Indigenous communities, which affects the representativeness of the NT results. Approximately 20 per cent of the resident population of the NT live in discrete Indigenous communities.
Nationally in 2020-21, the majority of respondents who needed to and saw a GP reported that the GP always or often:
- listened carefully (92.7 per cent) (figure 10.10a)
- showed respect (95.0 per cent)
- spent enough time with them (91.8 per cent) (tables 10A.55-56).
Nationally in 2020-21, the majority of respondents who needed to and saw a dental professional reported that the dental professional always or often:
- listened carefully (96.7 per cent) (figure 10.10b)
- showed respect (97.5 per cent).
- spent enough time with them (97.6 per cent) (tables 10A.57-58).
Data for measures 1–6 are presented by remoteness in tables 10A.55-58.
12. Continuity of care
‘Continuity of care’ is an indicator of governments’ objective to ensure that services are well co-ordinated to ensure continuity of care where more than one service type and/or ongoing service provision is required.
‘Continuity of care’ is defined by three measures:
- the proportion of GP management plans and team care assessment plans that have been reviewed in the past 12 months
- the proportion of people who saw three or more health professionals in the last 12 months for the same condition and who reported that a health professional helped coordinate their care and that this coordination of care helped to a large extent
- the proportion of people who saw three or more health professionals in the last 12 months for the same condition and who reported that issues were caused by a lack of communication between the health professionals.
For the first measure, proportions are calculated by dividing the number of MBS subsidised GP management plans and team care assessment plans reviewed (Medicare item no. 732), by the total number of MBS subsidised GP management plans (Medicare item no. 721) and team care assessment plans (Medicare item no. 723), multiplied by 100.
A high or increasing proportion of GP management and team care assessment plans reviewed is desirable.
The second and third measures are enumerated using data from the ABS Patient Experience Survey (PExS) of people aged 15 years and over. The PExS does not include people living in discrete Indigenous communities, which affects the representativeness of the NT results for both measures. Approximately 20 per cent of the estimated resident population of the NT live in discrete Indigenous communities.
For the second measure, a high or increasing proportion of patients who saw three or more different health professionals in the past 12 months for the same condition and who reported that a health professional helped coordinate their care and that this coordination of care helped to a large extent is desirable.
For the third measure, a low or decreasing proportion of patients who saw three or more different health professionals in the past 12 months for the same condition and who reported that issues were caused by a lack of communication between health professionals is desirable.
Nationally in 2020-21, 72.6 per cent of MBS subsidised GP management plans and team care assessment plans were reviewed — a decrease from 73.6 per cent in 2019-20 (figure 10.11a).
Nationally in 2020-21, the proportion of people who saw three or more health professionals in the last 12 months for the same condition and who reported that:
- a health professional helped coordinate their care and that this coordination of care helped to a large extent was 71.6 per cent (figure 10.11b)
- issues were caused by a lack of communication between the health professionals was 13.1 per cent (figure 10.11c).
13. Workforce sustainability
‘Workforce sustainability’ is an indicator of governments’ objective to provide sustainable primary and community healthcare services.
‘Workforce sustainability’ is defined by two measures:
- the proportion of full time equivalent (FTE) GPs in ten-year age brackets
- the attrition rate of FTE GPs who exit the workforce as a proportion of the number of FTE GPs by age bracket.
A high or increasing percentage of the workforce that are new entrants and/or low or decreasing proportions of the workforce that are close to retirement is desirable. A low or decreasing rate of workforce attrition is desirable.
These measures are not a substitute for a full workforce analysis that allows for migration, trends in full-time work and expected demand increases. They can, however, indicate that further attention should be given to workforce sustainability for GPs.
The attrition rate is measured as the proportion of GPs who were in scope in 2019, but not in scope in 2020. In scope is defined as Primary Care GPs, being GPs working in the treatment of non‑admitted patients in the community. GPs who ‘exited’ (i.e., were no longer in scope) in 2020 might still be in the medical workforce and practicing as a GP but are classified as an exit as they are no longer Primary Care GPs.
Nationally in 2020, 39.2 per cent of FTE general practitioners were aged 55 years or older, compared to 9.0 per cent who were less than 35 years of age (figure 10.12).
Nationally in 2020, the proportion of general practitioners who exited the GP workforce was 1.3 per cent, with the proportion highest for those 65 years and over (table 10.4).
14. Cost to government of general practice per person
‘Cost to government of general practice per person’ is an indicator of governments’ objective to provide primary and community health services in an efficient manner.
‘Cost to government of general practice per person’ is defined as the cost to government of general practice per person in the population.
This indicator should be interpreted with care. A low or decreasing cost per person can indicate higher efficiency, provided services are equally or more effective. It can also reflect service substitution between primary healthcare and hospital or specialist services — potentially at greater expense.
Cost to government of general practice does not capture costs of salaried GP service delivery models, used particularly in rural/remote areas, where primary healthcare services are provided by salaried GPs in community health settings, through emergency departments, and Aboriginal and Torres Strait Islander primary healthcare services. Therefore, costs are understated for jurisdictions where a large proportion of the population live in rural and remote areas.
Nationally in 2020-21, total expenditure per person on general practice was $437 per person, increasing in real terms from $415 in 2019-20 (figure 10.13).
15. Notifications of selected childhood diseases
‘Notifications of selected childhood diseases’ is an indicator of governments’ objective for primary and community health services to promote health and prevent illness.
‘Notifications of selected childhood diseases’ is defined as the number of notifications of measles, pertussis and invasive Haemophilus influenzae type b reported to the National Notifiable Diseases Surveillance System by State and Territory health authorities for children aged 0–14 years, per 100 000 children in that age group.
A low or reducing notification rate for the selected diseases indicates that the immunisation program is more effective.
Measles, pertussis (whooping cough) and invasive Haemophilus influenzae type b are nationally notifiable vaccine preventable diseases, and notification to the relevant State or Territory authority is required on diagnosis.
Nationally in 2020-21, the rate of notifications for children aged 0–14 years was:
- 0.3 per 100 000 for Haemophilus influenzae type b
- 0.0 per 100 000 for measles
- 2.4 per 100 000 for pertussis (whooping cough) (figure 10.14 and table 10A.64).
16. Selected potentially preventable hospitalisations
‘Selected potentially preventable hospitalisations’ is an indicator of governments’ objective for primary and community health services to promote health, prevent illness and to support people to manage their health issues in the community.
‘Selected potentially preventable hospitalisations’ is defined as hospital admissions that may be avoided by effective management of illness and injury in the primary and community healthcare sector or, in some cases, by preventing illness and injury altogether. Two measures of selected potentially preventable hospitalisations are reported by jurisdiction of residence:
- Potentially preventable hospitalisations for selected vaccine preventable, acute and chronic conditions
- Potentially preventable hospitalisations for diabetes (Type 2 diabetes mellitus as principal diagnosis).
Low or decreasing separation rates for selected potentially preventable hospitalisations can indicate more effective management of selected conditions in the primary and community healthcare sector and/or more effective preventative programs. Factors outside the control of the primary and community healthcare sector also influence hospitalisation rates for these conditions. For example, the underlying prevalence of conditions, patient compliance with management and older people’s access to aged care services and other support.
Nationally in 2019-20, the age standardised hospital separation rate for selected vaccine preventable, acute and chronic conditions was 25.5 per 1000 people (table 10.5).
For both Aboriginal and Torres Strait Islander people and other Australians, the age-standardised rates have increased over the 10 years of data in this Report, with the rate for Aboriginal and Torres Strait Islander people around three times the rate for other Australians.
Nationally in 2019-20, the age-standardised hospital separation rate for diabetes was 129.3 separations per 100 000 people (table 10.6).
The age-standardised separation rate for Aboriginal and Torres Strait Islander people (excluding separations for diabetes complications as an additional diagnosis) was 2.7 times the rate for all Australians (table 10A.72).
The most serious complication of Type 2 diabetes most commonly leading to hospitalisation in 2019-20 was circulatory complications, with an age standardised rate of 18.2 per 100 000 people (table 10A.73). Serious circulatory complications of diabetes can necessitate lower limb amputation. In 2019-20, there were 20.0 age-standardised hospital separations per 100 000 people for lower limb amputations where Type 2 diabetes mellitus was a principal or additional diagnosis (table 10A.75).
Performance indicator data for Aboriginal and Torres Strait Islander people in this section are available in the data tables listed below. Further supporting information can be found in the 'Indicator results' tab and data tables.
| Table number | Table title |
|---|---|
| Table 10A.17 | Approved providers of PBS medicines by PhARIA area at 30 June |
| Table 10A.18 | Approved providers of PBS medicines by geolocation, at 30 June |
| Table 10A.23 | Annual health assessments for older people by Indigenous status (per cent) |
| Table 10A.24 | Aboriginal and Torres Strait Islander people who received a health check or assessment, by age (per cent) |
| Table 10A.34 | Median waiting time for public dental care, NSW (days) |
| Table 10A.35 | Median waiting time for public dental care, Victoria (days) |
| Table 10A.36 | Median waiting time for public dental care, Queensland (days) |
| Table 10A.37 | Median waiting time for public dental care, WA (days) |
| Table 10A.38 | Median waiting time for public dental care, SA (days) |
| Table 10A.39 | Median waiting time for public dental care, Tasmania (days) |
| Table 10A.40 | Median waiting time for public dental care, ACT (days) |
| Table 10A.41 | Median waiting time for public dental care, NT (days) |
| Table 10A.49 | Influenza vaccination coverage for people aged 65 years and over |
| Table 10A.51 | Participation rates for Aboriginal and Torres Strait Islander women screened by BreastScreen Australia (24 month period) (first and subsequent rounds) (per cent) |
| Table 10A.66 | Separations for selected potentially preventable hospitalisations by Indigenous status (per 1000 people) |
| Table 10A.68 | Separations for selected potentially preventable hospitalisations by Indigenous status and remoteness, Australia (per 1000 people) |
| Table 10A.69 | Separations for selected vaccine preventable conditions by Indigenous status (per 1000 people) |
| Table 10A.70 | Separations for selected acute conditions by Indigenous status (per 1000 people) |
| Table 10A.71 | Separations for selected chronic conditions by Indigenous status (per 1000 people) |
| Table 10A.72 | Selected potentially preventable hospitalisations, ratio of separations for Aboriginal and Torres Strait Islander people to all Australians, diabetes |
Key terms
| Terms | Definition |
|---|---|
Age standardised | Removing the effect of different age distributions (across jurisdictions or over time) when making comparisons, by weighting the age‑specific rates for each jurisdiction by the national age distribution. |
Annual cycle of care for people with diabetes mellitus within general practice | The annual cycle of care comprises the components of care, delivered over the course of a year, that are minimum requirements for the appropriate management of diabetes in general practice based on RACGP guidelines. MBS items can be claimed on completion of the annual cycle of care according to MBS requirements for management, which are based on but not identical to the RACGP guidelines. |
Asthma action plan | An asthma action plan is an individualised, written asthma action plan incorporating information on how to recognise the onset of an exacerbation of asthma and information on what action to take in response to that exacerbation, developed in consultation with a health professional. Source: National Asthma Council Australia, 2019 Australian Asthma Handbook , Version 2.0. National Asthma Council Australia, Melbourne, accessed 18 October 2019: https://www.nationalasthma.org.au/health-professionals/asthma-action-plans |
Australian classification of health interventions (ACHI) | Developed by the National Centre for Classification in Health, the ACHI comprises a tabular list of health interventions and an alphabetic index of health intervention. |
Cervical screening test | A cervical screening test consists of a human papillomavirus (HPV) test with partial genotyping and, if the HPV test detects oncogenic HPV, liquid based cytology (LBC). |
Closed treatment episode | A closed treatment episode is a period of contact between a client and an alcohol and other drug treatment agency. It has defined dates of commencement and cessation, during which the principal drug of concern, treatment delivery setting and main treatment type did not change. Reasons for cessation of a treatment episode include treatment completion, and client non‑participation in treatment for 3 months or more. Clients may have more than one closed treatment episode in a data collection period. |
Community health services | Health services for individuals and groups delivered in a community setting, rather than via hospitals or private facilities. |
Comparability | Data are considered comparable if (subject to caveats) they can be used to inform an assessment of comparative performance. Typically, data are considered comparable when they are collected in the same way and in accordance with the same definitions. For comparable indicators or measures, significant differences in reported results allow an assessment of differences in performance, rather than being the result of anomalies in the data. |
Completeness | Data are considered complete if all required data are available for all jurisdictions that provide the service. |
Consultations | The different types of services provided by GPs. |
Cost to government of general practice per person | Cost to the Australian Government of total non‑referred attendances by non‑specialist medical practitioners per person. |
General practice | The organisational structure with one or more general practitioners (GPs) and other staff such as practice nurses. A general practice provides and supervises healthcare for a ‘population’ of patients and may include services for specific populations, such as women’s health or Aboriginal and Torres Strait Islander health. |
General practitioner (GP) | Vocationally registered GPs — medical practitioners who are vocationally registered under s.3F of the Health Insurance Act 1973 (Cwlth), hold Fellowship of the Royal Australian College of General Practitioners (RACGP) or the Australian College of Rural and Remote Medicine (ACRRM) or equivalent, or hold a recognised training placement. From 1996 vocational registration is available only to GPs who attain Fellowship of the RACGP or (from April 2007) the ACRRM, or hold a recognised training placement. |
General practitioner full time equivalent (GP FTE) | GP FTE is a workforce specific method to estimate the workload of GPs. The method calculates a GP’s workload based on the MBS services claimed as well as patient and doctor factors that affect the duration of a consultation. One GP FTE represents a 40 hour week per week for 46 weeks of the year. For each Medicare provider, the measure attributes an estimate of the amount of time they have spent on their claims compared to what would be worked by a full-time GP, including billable time, non-billable time, and non-clinical time. |
General practitioner (GP) Headcount | GP Headcount is a workforce specific method of headcount for GPs working in Australia (number of GPs). The method uses elements from the MBS data set to count when, where and by what type of practitioner GP services are being delivered. The number of GPs is based on the following aspects of MBS data:
|
GP‑type services | Non‑referred attendances by vocationally registered GPs and OMPs, and practice nurses. |
Haemophilus influenzae type b | A bacterium which causes bloodstream infection, meningitis, epiglottitis, and pneumonia (Department of Health 2018). |
Human papillomavirus (HPV) test | An HPV test uses a sample of cervical cells to determine whether the cells are infected with a high-risk strain of HPV, which could cause changes to cervical cells leading to cervical cancer. |
| ICD-10-AM | The International Statistical Classification of Diseases and Related Health Problems - 10th Revision - Australian modification (ICD-10-AM) is the current classification of diagnoses in Australia. |
Non‑referred attendances | GP services, emergency attendances after hours, other prolonged attendances, group therapy and acupuncture. All attendances for specialist services are excluded because these must be ‘referred’ to receive Services Australia Medicare reimbursement. |
Nationally notifiable disease | A communicable disease that is on the Communicable Diseases Network Australia’s endorsed list of diseases to be notified nationally (Department of Health 2013). On diagnosis of these diseases, there is a requirement to notify the relevant State or Territory health authority. |
Other medical practitioner (OMP) | A medical practitioner other than a vocationally registered GP who has at least half of the schedule fee value of his/her Services Australia Medicare billing from non‑referred attendances. These practitioners are able to access only the lower A2 Services Australia Medicare rebate for general practice services they provide, unless the services are provided through certain Departmental incentive programs. |
Pap smear | A procedure used to detect pre-cancerous abnormalities of the cervix. |
PBS doctor’s bag | Emergency drug supplies provided without charge to prescribers for use in medical emergencies in the clinic or community at no charge to the patient. |
Per person benefits paid for GP ordered pathology | Total benefits paid under Services Australia Medicare for pathology tests requested by GPs, divided by the population. |
Per person benefits paid for GP referred diagnostic imaging | Total benefits paid for diagnostic imaging services performed on referral by GPs, divided by the population. |
Primary healthcare | The primary and community healthcare sector includes services that:
|
Primary Health Networks | Primary Health Networks (PHNs) are a national network of independent primary health care organisations (replacing Medicare Locals from 1 July 2015) designed to improve the efficiency and effectiveness of medical services for patients at risk of poor health outcomes and improve care coordination, particularly for those with chronic and complex conditions. |
Prevalence | The proportion of the population suffering from a disorder at a given point in time (point prevalence) or given period (period prevalence). |
Public health | The organised, social response to protect and promote health and to prevent illness, injury and disability. The starting point for identifying public health issues, problems and priorities, and for designing and implementing interventions, is the population as a whole or population subgroups. Public health is characterised by a focus on the health of the population (and particular at‑risk groups) and complements clinical provision of healthcare services. |
Recognised immunisation provider | A general practitioner or an individual, or body, endorsed by the Commonwealth, a State or Territory to administer vaccines in Australia. |
Recognised specialist | A medical practitioner classified as a specialist by the Medical Board of Australia and on the Services Australia Medicare database earning at least half of his or her income from relevant specialist items in the schedule, having regard to the practitioner’s field of specialist recognition. |
Screening | The performance of a test or tests on apparently well people to detect a medical condition earlier than would otherwise be possible. |
Socio-Economic Indexes for Areas (SEIFA) | Socio-Economic Indexes for Areas (SEIFA) quintiles are based on the ABS Index of Relative Socio-Economic Disadvantage (IRSD), with quintile 1 being the most disadvantaged and quintile 5 being the least disadvantaged. Each SEIFA quintile represents approximately 20 per cent of the national population, but does not necessarily represent 20 per cent of the population in each state or territory. |
Triage category | The urgency of the patient’s need for medical and nursing care:
|
References
AIHW (unpublished) National Dental Telephone Interview Survey.
COAG Health Council 2015, Healthy Mouths, Healthy Lives: Australia’s National Oral Health Plan 2015–2024, http://www.coaghealthcouncil.gov.au/Portals/0/Australia%27s%20National%20Oral%20Health%20Plan%202015-2024_uploaded%20170216.pdf (accessed 11 November 2020).
Department of Health 2020, PBS expenditure and prescriptions 1 July 2019 to 30 June 2020, PBS_Expenditure_and_Prescriptions_Report_1-July-2019_to_30-June-2020.pdf (accessed 5 October 2021).
—— 2018, Questions about vaccination, https://beta.health.gov.au/ resources/publications/questions-about-vaccination (accessed 16 November 2018).
—— 2013, Australian national notifiable diseases list and case definitions, http://www.health.gov.au/internet/main/publishing.nsf/Content/cda_surveil‑nndss‑dislist.htm (accessed 8 January 2014).
—— unpublished, MBS Statistics.
Department of Veterans Affairs (unpublished) DVA Collection.
Services Australia 2021, Practice Incentives Program (PIP), Practice Incentives Program - Services Australia (accessed 5 October 2021).
Download supporting material
- 10 Primary and community health data tables (XLSX - 854 Kb)
- 10 Primary and community health dataset (CSV - 2528 Kb)
See the corresponding table number in the data tables for detailed definitions, caveats, footnotes and data source(s).