Report on Government Services 2023
Part D, Section 9: RELEASED ON 31 JANUARY 2023
9 Emergency services for fire and other events
This section focuses on performance reporting for emergency services for fire events. Descriptive information is included on emergency services for other events, with performance reporting to be developed for future Reports.
The Indicator results tab uses data from the data tables to provide information on the performance for each indicator in the Indicator framework. The same data are also available in CSV format.
Data downloads
- 9 Emergency services data tables (XLSX - 275 Kb)
- 9 Emergency services dataset (CSV - 669 Kb)
See the corresponding table number in the data tables for detailed definitions, caveats, footnotes and data source(s).
- Context
- Indicator framework
- Indicator results
- Explanatory material
Objectives for emergency services for fire and other events
Emergency services for fire and other events aim to reduce the adverse effects of events on the community (including people, property, infrastructure, the economy and the environment). Governments’ involvement is aimed at providing emergency services that:
- contribute to the community's management of risks and its preparedness, through the promotion of risk reduction and mitigation activities
- are accessible, responsive and sustainable.
Governments aim for emergency services to meet these objectives in an equitable and efficient manner.
Service overview
An emergency event is an event that endangers or threatens to endanger life, property and/or the environment, and requires a significant and coordinated response. A fire event is an incident that is reported to a fire service organisation and requires a response. Fire events include (but are not limited to):
- structure fires (that is, fires inside a building or structure), regardless of whether there is damage to the structure
- landscape fires, including bushfires and grass fires, regardless of the size of the area burnt
- other fires, including vehicle and other mobile property fires, and outside rubbish fires.
Other events that require an emergency response from fire and/or state and territory emergency services include road crash rescue, floods, storms and other natural disasters.
Roles and responsibilities
Fire service organisations and state and territory emergency services (STES) are some of the primary agencies involved in providing emergency services for fire and other events. The role of these organisations varies across jurisdictions but commonly includes prevention/mitigation, preparedness, response and recovery activities.
Each state and territory government operates multiple emergency service agencies, which service different populations and geographic areas according to specified governance arrangements (table 9.1 below). Fire service and STES organisations work closely with other government departments and agencies that also have responsibilities in the case of fire and other emergency events.
This section covers the finances and activities of urban and rural fire service organisations and STES. For selected tables and jurisdictions, the fire service organisation data includes finances and activities of the relevant land management agencies.
| NSW | Fire and Rescue NSW (FRNSW) and NSW Rural Fire Service (RFS) (the fire agencies); National Parks and Wildlife Service (NPWS) and Forestry Corporation NSW (FCNSW) (for fire response on their managed lands) and NSW State Emergency Service (SES) (for flood, storm and tsunami). |
|---|---|
| Vic | Fire Rescue Victoria (FRV); Country Fire Authority (CFA) and Forest Fire Management Victoria (FFMVic) and Victoria State Emergency Service (VICSES). |
| Qld | Queensland Fire and Emergency Services (QFES) - Fire and Rescue Service; Rural Fire Service; State Emergency Service; and the Queensland Parks and Wildlife Service and Partnerships (QPWS&P), Department of Environment and Science (public land). |
| WA | WA Department of Fire and Emergency Services (DFES). |
| SA | South Australian Metropolitan Fire Service; South Australian Country Fire Service (CFS); Forestry SA and SA State Emergency Service (SES). |
| Tas | Tasmania Fire Service (TFS) (for urban, structural and privately managed rural land); Tasmanian Parks & Wildlife Service (PWS) (for national parks and other reserves, including future potential production forest lands); Sustainable Timber Tasmania (STT) (for declared forest land/State forest); Tasmania State Emergency Service (SES) (for floods, storms/severe weather, coastal inundation (storm tide)). |
| ACT | ACT Fire and Rescue; ACT Rural Fire Service (RFS); ACT Parks and Conservation Service and ACT State Emergency Service (ACTSES). |
| NT | NT Fire and Rescue Service; Bushfires NT; Parks and Wildlife Commission of the NT and NT Emergency Service (NTES) (for cyclone, earthquake, floods, storm surge and water damage and tsunami). |
Funding
Nationally in 2021-22, the total revenue of fire service organisations was $5.9 billion (including WA STES), a decrease of 2.0 per cent from 2020-21.
STES revenue (excluding WA) was $369 million, an increase of 23.9 per cent from 2020-21. This was driven by a $61.7 million increase in NSW levy revenue. A single department is responsible for both fire and emergency services in WA and revenue cannot be separately reported for their State Emergency Service (including volunteer marine rescue) (table 9.2).
Funding models to resource fire service organisations and STES organisations differ across jurisdictions. For fire services in four jurisdictions (NSW, Victoria, the ACT and the NT), over 50 per cent of revenue was from government grants in 2021-22. In the ACT and the NT, the proportion was over 90 percent. Levies were the largest source of revenue (over 60 per cent) in 2021-22 in Queensland, WA, SA and Tas (table 9A.1)
For STES in 2021-22, State/Territory government grants provided over 90 per cent of revenue for Victoria, Queensland, the ACT and the NT. Levies were the largest revenue source in NSW and SA (at least 78 per cent) (table 9A.2).
The Australian Government provides funding to State and Territory governments through programs including:- the Disaster Recovery Funding Arrangements, which provide assistance with relief and recovery efforts following an eligible natural disaster. In 2021-22, the Australian Government provided $652.4 million in cash payments to states and territories (Australian Government 2022). This figure differs from the estimate in table 9A.3 which reflects payments to states and territories on an accrual basis. Allocations vary across jurisdictions and over time depending on the timing and nature of natural disaster events.
- the Preparing Australia Package and Prepared Communities Fund, which supports projects that mitigate or reduce the risk, impact and consequences associated with large-scale natural hazards. In 2021-22, the Australian Government spent $149.9 million on this fund (table 9A.3).
- the Disaster Risk Reduction Fund, which supports initiatives to reduce the risk and limit the impact of disasters in line with the National Disaster Risk Reduction Framework. In 2021-22, the Australian Government provided $20.9 million in funding under this program (table 9A.3).
- the Emergency Response Fund, which complements existing sources of funding for emergency response and disaster recovery. In 2021-22, the Australian Government committed $200.0 million from the Emergency Response Fund (table 9A.3).
In 2021-22, the Australian Government also provided $2.1 billion in financial support to eligible individuals affected by a disaster (by far the highest amount over the 10 years of reported data) (table 9A.3).
Size and scope
Human resources
Nationally in 2021-22, 23 239 full time equivalent (FTE) paid personnel were employed by fire service organisations, with the majority (76.2 per cent) firefighters. A large number of volunteer personnel (193 312 people) also participated in the delivery of services in 2021-22, a decrease of 3.7 per cent from 2020-21. The proportion of volunteer personnel and the nature of their role varied across jurisdictions (table 9A.4).
For STES, the majority of personnel were volunteers. In 2021-22 there were 24 642 STES volunteers, a decrease of 1.7 per cent from 2020-21 and 879 paid staff, an increase of 12.7 per cent from 2020-21. The proportion of volunteer and paid personnel and the nature of their roles varied across jurisdictions (table 9A.5).
Demand for emergency services
Fire service organisations and STES provide emergency response and rescue services for a range of fire and other emergency events. Nationally in 2021-22, fire service organisations attended 393 267 emergency incidents, of which 74 237 were fire events. Fire service organisations also responded to other incident types including road crash rescues, floods and storms, and other hazardous conditions. The number of emergency incidents that fire service organisations have responded to over the past five years has increased by 8.5 per cent on average each year since 2017-18 (table 9A.6).
In 2021-22, STES organisations (excluding Queensland) attended 119 258 incidents, the majority of which were storm and cyclone events (66.2 per cent or 78 982 events). The number of incidents requiring STES attendance over the past five years has increased by 21.3 per cent on average each year since 2017-18 (table 9A.7).
The performance indicator framework provides information on equity, effectiveness and efficiency, and distinguishes the outputs and outcomes of emergency services for fire events.
The performance indicator framework shows which data are complete and comparable in this Report. For data that are not considered directly comparable, text includes relevant caveats and supporting commentary. Section 1 discusses data comparability and completeness from a Report-wide perspective. In addition to the contextual information for this service area (see Context tab), the Report’s statistical context (section 2) contains data that may assist in interpreting the performance indicators presented in this section.
Improvements to performance reporting for emergency services for fire and other events are ongoing and include identifying data sources to fill gaps in reporting for performance indicators and measures, and improving the comparability and completeness of data.
Outputs
Outputs are the services delivered (while outcomes are the impact of these services on the status of an individual or group) (see section 1). Output information is also critical for equitable, efficient and effective management of government services.
Outcomes
Outcomes are the impact of services on the status of an individual or group (see section 1).
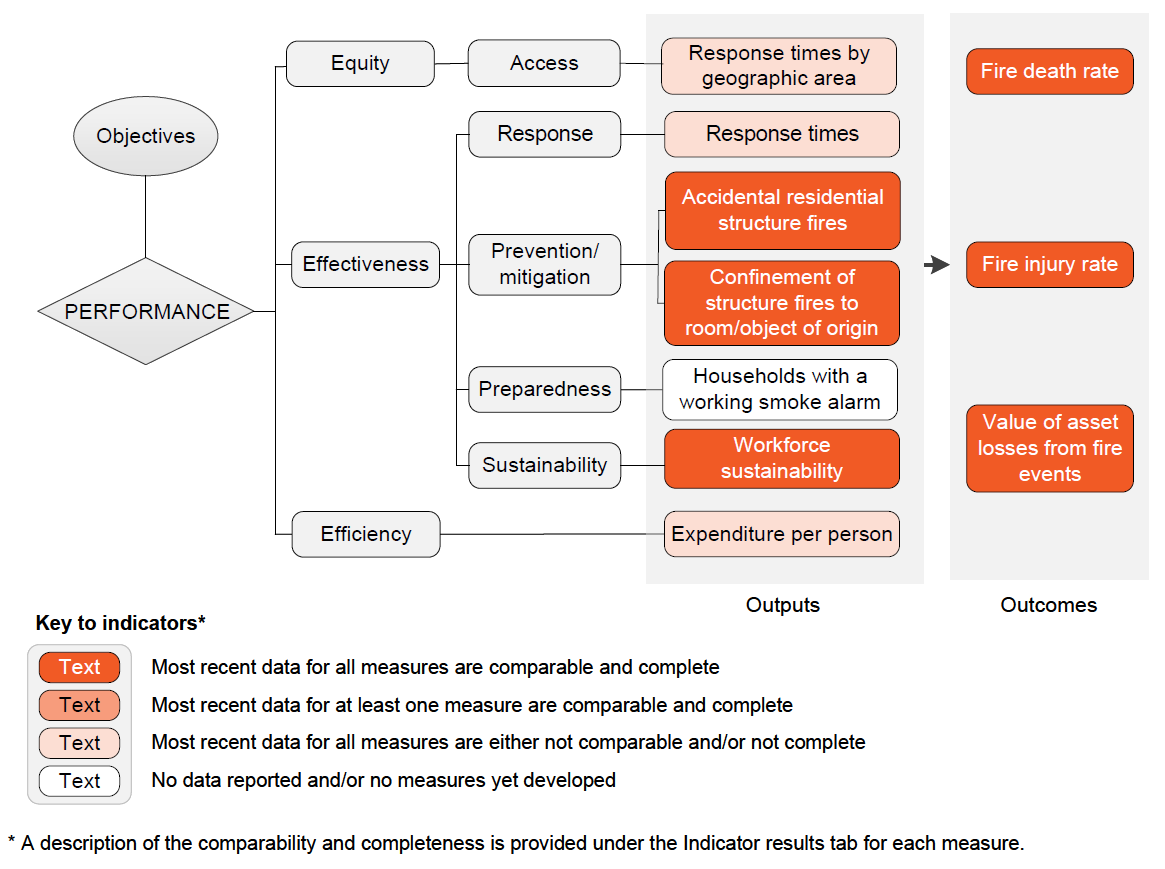
Text version of indicator framework
Performance — linked to Objectives
Outputs
- Equity — Access
- Response times by geographic area – most recent data for all measures are either not comparable and/or not complete
- Effectiveness — Response
- Response times – most recent data for all measures are either not comparable and/or not complete
- Effectiveness — Prevention/mitigation
- Accidental residential structure fires – most recent data for all measures are comparable and complete
- Confinement of structure fires to room/object of origin – most recent data for all measures are comparable and complete
- Effectiveness — Preparedness
- Households with a working smoke alarm – no data reported and/or no measures yet developed
- Effectiveness — Sustainability
- Workforce sustainability – most recent data for all measures are comparable and complete
- Efficiency
- Expenditure per person – most recent data for all measures are either not comparable and/or not complete
Outcomes
- Fire death rate – most recent data for all measures are comparable and complete
- Fire injury rate – most recent data for all measures are comparable and complete
- Value of asset losses from fire events – most recent data for all measures are comparable and complete
A description of the comparability and completeness is provided under the Indicator results tab for each measure.
This section presents an overview of 'Emergency services for fire and other events' performance indicator results. Different delivery contexts, locations and types of clients can affect the equity, effectiveness and efficiency of emergency services.
Information to assist the interpretation of these data can be found with the indicators below and all data (footnotes and data sources) are available for download above as an excel spreadsheet and as a CSV dataset. Data tables are identified by a ‘9A’ prefix (for example, table 9A.1).
Specific data used in figures can be downloaded by clicking in the figure area, navigating to the bottom of the visualisation to the grey toolbar, clicking on the 'Download' icon and selecting 'Data' from the menu. Selecting 'PDF' or 'Powerpoint' from the 'Download' menu will download a static view of the performance indicator results.
1. Response times by geographic area
‘Response times by geographic area’ is a proxy indicator of governments’ objective to provide fire services in an equitable manner.
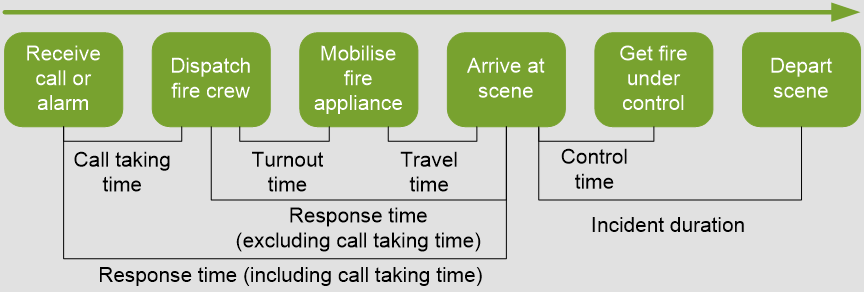
‘Response times by geographic area’ (as illustrated below) is defined as the time taken between the arrival of the first fire crew appliance (that is, fire engine, truck or other fire emergency vehicle) at the scene of a structure fire and:
- initial receipt of the triple zero (000) call at the communications centre (including call taking time), by remoteness area. Response time (including call taking time) reflects jurisdictions’ overall responsiveness to the notification of a structure fire
- dispatch of the responding fire crew (excluding call taking time), by remoteness area. Response time (excluding call taking time) reflects service organisations’ responsiveness to the notification of a structure fire.
Response times are measured for emergency calls only.
Response times are calculated as the time (in minutes) within which 50 per cent of first responding fire crews arrived at the scene of a structure fire and the time (in minutes) within which 90 per cent of first responding fire crews arrived at the scene of a structure fire.
Many factors influence response times by geographic area including:
- land area
- population size and density
- dispersion of the population (particularly rural/urban population proportions), topography, road/transport infrastructure and traffic densities
- crew configurations, response systems and processes, and travel distances — for example, some jurisdictions include responses from volunteer stations (often in rural areas) where turnout times are generally longer because volunteers are on call as distinct from being on duty.
Similar response times across different geographies suggest equitable access by area. Low numbers of structure fire incidents often exist in remote and very remote locations. This can contribute to large fluctuations in response times in these areas.
In 2021-22, the time within which 50 per cent of the first responding fire crew appliances arrived at the scene of a structure fire within major cities ranged from:
- 5.8 to 9.4 minutes including call taking time
- 5.5 to 7.8 minutes excluding call taking time (table 9.3).
In 2021-22, the time within which 90 per cent of the first responding fire crew appliances arrived at the scene of a structure fire within major cities ranged from:
- 8.4 to 13.3 minutes including call taking time
- 7.9 to 11.4 minutes excluding call taking time (table 9.3).
Response times are generally longer for all jurisdictions in regional and remote areas, compared to major cities (table 9.3).
2. Response times
‘Response times’ is an indicator of governments’ objective to provide emergency services that are accessible and responsive.
‘Response times’ is defined as the time taken between the arrival of the first fire crew appliance (that is, fire engine, truck or other fire emergency vehicle) at the scene of a structure fire and:
- initial receipt of the triple zero (000) call at the communications centre. Response time (including call taking time) reflects jurisdictions’ overall responsiveness to the notification of a structure fire
- dispatch of the responding fire crew. Response time (excluding call taking time) reflects service organisations’ responsiveness to the notification of a structure fire.
See Response times by geographic area for further information on the scope and calculation of response times.
Shorter response times suggest that services are more accessible and responsive.
In 2021-22, the time within which 50 per cent of the first responding fire crew appliances arrived at the scene of a structure fire statewide ranged from:
- 6.2 to 10.0 minutes including call taking time
- 4.3 to 8.2 minutes excluding call taking time.
In 2021-22, the time within which 90 per cent of the first responding fire crew appliances arrived at the scene of a structure fire statewide ranged from:
- 10.5 to 20.7 minutes including call taking time
- 9.4to 15.3 minutes excluding call taking time (figure 9.1).
3. Accidental residential structure fires
‘Accidental residential structure fires’ is an indicator of governments’ objective to contribute to the community’s management of risks through the promotion of risk reduction and mitigation activities.
‘Accidental residential structure fires’ is defined as the rate of accidental residential structure fires per 100 000 households.
Accidental residential structure fires are defined as fires that are not deliberately lit and could have been reduced or prevented with effective education programs.
A low or decreasing incidence of accidental residential structure fire indicates greater community preparedness.
The rate of accidental residential structure fires per 100 000 households should be interpreted with caution. In particular, rates are affected by differences across jurisdictions in distinguishing accidental structure fires from structure fires resulting from other causes.
In 2021-22, the national rate of accidental residential structure fires was 68.3 per 100 000 households, a decrease from 75.3 in 2020-21 and the lowest rate in the last 10 years (figure 9.2).
Supporting data on accidental residential structure fires by smoke alarm status are available in table 9A.12. Refer to Households with a working smoke alarm for more information.4. Confinement of structure fires to room/object of origin
‘Confinement of structure fires to room/object of origin’ is an indicator of governments’ objective to contribute to the community’s management of risks through the promotion of risk reduction and mitigation activities.
‘Confinement of structure fires to room/object of origin’ is defined as the proportion of structure fires confined to the room, part room or object of origin, by ignition type.
Structure fires include building fires and fires in buildings confined to non‑combustible containers. Structure fires without a value attributed to confinement are excluded.
The ignition types reported separately are: all; accidental; incendiary and suspicious; and other.
A high or increasing proportion of structure fires confined to the room, part room or object of origin is desirable.
Nationally in 2021-22, 78.2 per cent of structure fires were confined, a decrease from a slight ten year high of 78.8 per cent in 2020-21. The rate of confinement in 2021-22 was highest for accidental structure fires (85.5 per cent) and lowest for structure fires by other ignition types (59.4 per cent). The rate of confinement for incendiary and suspicious structure fires in 2021-22 was 65.6 per cent (figure 9.3).
5. Households with a working smoke alarm
‘Households with a working smoke alarm’ is an indicator of governments’ objective to contribute to the community’s management of risks and its preparedness.
‘Households with a working smoke alarm’ is defined by the proportion of all households with a smoke alarm that is operational/has been tested (manually in the past 12 months).
A high or increasing proportion of households with an operational smoke alarm indicates greater community preparedness.
Data are not yet available for reporting against this indicator.
Administrative data on accidental residential structure fires by smoke alarm status are available in table 9A.12. Nationally in 2021-22 (excluding NSW), 34.8 per cent of accidental residential structure fires had a complete Australian Incident Reporting System (AIRS) smoke alarm operation code. The smoke alarm operated in 56.8 per cent of these fires, but in other instances did not operate (7.9 per cent), was not present (21.0 per cent) or was too small (14.4 per cent) (table 9A.12).
Refer also to Accidental residential structure fires for more information.
6. Workforce sustainability
‘Workforce sustainability’ is an indicator of governments’ objective to provide emergency services that are sustainable.
Firefighter workforce sustainability concerns the capacity of the firefighter workforce to meet current and projected demand.
‘Workforce sustainability’ is defined by two measures:
- ‘workforce by age group’ – the proportion of the firefighting workforce (headcount) in 10‑year age groups (under 30, 30–39, 40–49, 50–59 and 60 and over).
- ‘workforce attrition’ – the proportion of the firefighting workforce (headcount) who exited the organisation.
The firefighting workforce comprises any person employed or remunerated by the fire service organisation who delivers or manages a firefighting service directly to the community and who is formally trained and qualified to undertake firefighting duties. It includes permanent, part time and other employees. It excludes the support workforce (non-firefighting staff).
A low or decreasing proportion of the workforce in younger age groups and/or a high or increasing proportion of the workforce in older age groups suggest potential workforce sustainability problems as older age workers enter retirement. High and increasing levels of staff attrition also suggest potential workforce sustainability problems.
Nationally in 2021-22, 64.4 per cent of the firefighter workforce was aged under 50 years. This proportion has decreased each year since 2014-15 (from a high of 67.9 per cent in 2014-15) (figure 9.4).
Nationally in 2021-22, the (headcount) attrition rate was 6.6 per cent, an eight year high and increase from 6.2 per cent in 2021-22 and the eight year low of 5.0 per cent in 2019-20 (table 9.4). Full time equivalent (FTE) attrition rates are also provided in table 9A.4. Nationally in 2021-22, the FTE attrition rate was 1.9 (excluding Victoria).
7. Expenditure per person
‘Expenditure per person’ is a proxy indicator of governments’ objective to provide emergency services in an efficient manner.
‘Expenditure per person’ is defined as total fire service organisation expenditure per person in the population.
All else being equal, lower expenditure per person suggests greater efficiency. However, efficiency data should be interpreted with caution. High or increasing expenditure per person may reflect deteriorating efficiency. Alternatively, it may reflect changes in aspects of the service (such as improved response times), increased resourcing for fire prevention or community preparedness, or changes in the characteristics of fire events (such as more challenging fires).
Expenditure per fire is not used as a measure of efficiency because an organisation that works to reduce the number of fire incidents could erroneously appear to be less efficient due to fixed capital and labour costs.
The role of volunteers needs to be considered when interpreting this indicator. Volunteer personnel provide a substantial proportion of fire services (and emergency services more generally). While training and equipment costs associated with volunteers are included in the cost of fire service provision, the labour costs of providing fire services would be greater without volunteers (assuming these functions were still performed).
Time series data for real recurrent expenditure and capital costs (including associated costs for the user cost of capital) for each jurisdiction are reported in table 9A.14. Information on the treatment of assets by emergency management agencies is presented in table 9.5 in the Explanatory material.
Nationally in 2021-22, total fire service organisation expenditure per person in the population was $209, an increase from $207 per person in 2020-21 (figure 9.5). This is the highest level in the past 10 years except for the 2019-20 Australian bushfires year ($226 per person). Expenditure data disaggregated by labour, capital and other costs are available in table 9A.14.
8. Fire death rate
‘Fire death rate’ is an indicator of governments’ objective to reduce the adverse effects of emergency events on the community (including people, property, infrastructure, the economy and the environment).
‘Fire death rate’ is defined by two measures:
- ‘annual fire death rate’ – all deaths, per million people, where the underlying cause of death was fire related to smoke, fire and flames, and including all (structure and landscape) fires.
- ‘landscape fire death rate’ – deaths resulting from landscape fires only, per million people, as confirmed by a coroner or inquest or provisionally by the incident controller or by media reports.
Annual fire death rates can be volatile because of the small number of fire deaths and the influence of large irregular fire events.
No deaths or a decreasing rate of fire deaths is desirable.
Nationally in 2021, the annual fire death rate was 4.0 deaths per million people (104 fire deaths) (figure 9.6).
Nationally in 2021-22, there was 1 death related to landscape fires. This resulted in a rate of zero (figure 9.6).
Road traffic and exposure to forces of nature death rates are also reported in table 9A.16.
9. Fire injury rate
‘Fire injury rate’ is an indicator of governments’ objective to reduce the adverse effects of events on the community (including people, property, infrastructure, the economy and the environment).
‘Fire injury rate’ is defined as the rate of hospitalised fire injury cases per 100 000 people.
Estimates of fire injury cases are based on hospital separations data in the National Hospital Morbidity Database. Data exclude admitted patients transferred from another hospital, patients who died in hospital and patients admitted for rehabilitation.
No fire injuries or a decreasing number and rate of fire injuries is desirable.
Nationally in 2020-21, there were an estimated 3714 hospitalisations due to fire injury (table 9A.17), equating to a rate of 14.5 per 100 000 people. This rate is unchanged from 2019-20 (figure 9.7).
10. Value of asset losses from fire events
‘Value of asset losses from fire events’ is an indicator of governments’ objective to reduce the adverse effects of events on the community (including people, property, infrastructure, the economy and the environment).
‘Value of asset losses from fire events’ is defined as the estimated monetary value of the damage to domestic (household) property and contents caused by fire and firefighting operations based on insurance claims.
Insurance claims from major events, defined as total claims greater than $100 million, are excluded from the measure. Land value, claims handling costs, management costs, third party recoveries, and excess/deductibles are also excluded.
The value of household insurance claims from fire events reflects efforts to reduce the likelihood, effect and consequences of emergencies on communities. Lower or decreasing asset losses from fire events is desirable.
Data should be interpreted with caution as insurance claims may not reflect actual asset losses due to:
- under insurance — insurance payouts are limited by the estimated value of assets a policy holder provides when taking out insurance (and not all assets lost in fire events are insured)
- new for old — new for old policies replace an old asset for a new equivalent
- excess policy — small fire incidents are not recorded where no insurance claim is made by the policy holders (due to requirement for policy holders to pay excess).
Data reflect approximately 70 and 80 per cent of the potential domestic and commercial insurance markets respectively.
Nationally in 2021-22, the value of household fire event claims per person in the population was $21.63, the lowest claims value per person over the past 10 years (the highest value was $44.37 in 2013-14) (figure 9.8).
The average value of the 6242 fire event insurance claims for households was $89 303 in 2021-22, the highest value over the past 10 years. The total value of household asset losses from fire events was $557.4 million in 2021-22 (table 9A.18).
Supporting data on commercial fire event claims are available in table 9A.18.
Fire event insurance claims data, including major events are available in table 9A.18.
Other natural hazard event insurance claims data, including major events are available in table 9A.19. Nationally in 2021-22, the total value of household asset losses from other natural hazards was $5.3 billion, equivalent to $207 per person in the population (table 9A.19).
Interpreting efficiency data
| NSWb | Vic | Qld | WA | SA | Tas | ACTc | NT | ||
|---|---|---|---|---|---|---|---|---|---|
| Depreciation method | Depreciable assets | Straight‑line | Straight‑line | Straight‑line | Straight‑line | Straight‑line | Straight‑line | Straight‑line | Straight‑line |
| Revaluation method | Land | Fair or market value | Deprival or market value | Fair or market value | Fair value based on current market value or basis of existing use | Market value | Fair value or historical cost | Market value | na |
| Buildings | RFS: Fair or market value; FRNSW: Depreciated Replacement Cost for fire stations | Deprival or market value | Fair or market value | Fair value based on current market value or basis of existing use | Market value | Fair value or historical cost | Market value | na | |
| Other assets | RFS: Fair or market value; FRNSW: fire appliances: Depreciated Replacement Cost; Other P & E: Depreciated historical cost. | Deprival or market value | Fair or market value | na | Market value | na | na | na | |
| Frequency of revaluations (years) | Land, buildings | 3 | 1-5 | 1-5 | Annually | 6 | 5 | 3 | na |
| Other assets | 5 | 1-5 | Annually | Historical cost | 6 | na | na | na | |
| Useful asset lives (years)d | Buildings | 40 | 12-66 | 15-80 | 40 | 40-50 | 33-100 | 30-40 | 40 |
| Specialist equipment | RFS: 10; FRNSW: 15‑30 | 2-50 | 3-20 | 10-15 | 10-20 | 5-25 | 10 | 5-10 | |
| IT equipment | 3-5 | 3-5 | 3-5 | 3 | 5 | 5-10 | 4 | na | |
| Other vehicles | RFS: 3‑5; FRNSW: 2‑15 | 2-20 | 2-10 | 5-25 | 15-20 | 5-10 | 7-15 | 5-15 | |
| Office equipmente | RFS: 5‑10; FRNSW: 5‑20 | 2-20 | 3-10 | 10-15 | 10 | 3-10 | 10 | na | |
| Other equipmentf | – | 3-20 | 3-10 | 5-15 | 10 | 3-10 | 10 | na | |
| Threshold capitalisation levels ($) | Buildings | RFS: 10,000; FRNSW 3,000 | All | 10 000 | 5 000 | 10 000 | 10 000 | 5 000 | na |
| IT equipment | RFS: 10,000; FRNSW 3,000 | 1 000 | 5 000 | 5 000 | 10 000 | 10 000 | 5 000 | na | |
| Other assets | RFS: 10,000; FRNSW 3,000 | 1 000 | 5 000 | 5 000 | 10 000 | 10 000 | 5 000 | na |
a Market value is the current (net) value market selling price or exchange value; deprival value may be either the depreciated replacement cost of an asset of a similar service potential or the stream of its future economic benefits. b The assets used by the NSW Rural Fire Service are largely vested in Local Government. Accordingly, although issues such as asset depreciation and useful lives may be guided by Service policies, Local Government policies will prevail in other areas. c Treatment includes all four response agencies: the ACT Fire and Rescue, the ACT Rural Fire Service, the ACT State Emergency Service and the ACT Ambulance Service. Assets have been manually apportioned. Apportionment process varies from previous years. d Estimated as 1/depreciation rate. Asset lives for some assets have been grouped with other classifications. e For some jurisdictions, office equipment includes furniture and fittings. f For some jurisdictions, other equipment includes information technology. na Not available.
Source: State and Territory governments (unpublished).
Key terms
| Terms | Definition |
|---|---|
Expenditure | Includes:
Excludes interest on borrowings. |
User cost of capital | The opportunity cost of funds tied up in the capital used to deliver services. Calculated as 8 per cent of the current value of non‑current physical assets (including land, plant and equipment). |
Human resources | Any person delivering a service, or managing the delivery of this service, including:
|
Revenue | Revenue received directly or indirectly by fire service organisations on an accrual accounting basis, including: |
| Government grant funding | Grant funding, as established in legislation, from the Australian, State/Territory and Local governments. |
| Levies | Revenue from levies, as established in enabling legislation, raised on insurance companies and property owners. |
| User/transport charges | Revenue from fees and charges on individuals, private/public organisations and insurers. |
| Subscriptions and other income |
Other revenue, including:
|
| Indirect revenue | All revenue or funding received indirectly by the agency (for example, directly to Treasury or other such entity) that arises from the agency’s actions. |
Preparedness | Actions/programmes designed to strengthen the overall capacity and capability of a community to manage disasters; and procedures planned for during a non‑disaster response period to be actioned during a disaster response period to minimise the loss of life, injury and damage to property when a disaster occurs. |
Response | Actions taken in anticipation of, during and/or immediately after a disaster to ensure that its effects are minimised, and that affected people are provided with immediate care, relief and support. |
Volunteer firefighters | All personnel engaged on an unpaid casual basis by the emergency service organisation who deliver or manage a firefighting service directly to the community and who are formally trained and qualified to undertake firefighting duties, but do not receive remuneration other than reimbursement of ‘out of pocket expenses’. |
Volunteer support staff | All personnel engaged on an unpaid casual basis that are not remunerated and are principally involved in the provision of support services. For fire service organisations, this includes any staff whose immediate client is the firefighter. These can be people in operational support roles provided they do not receive payment for their services other than reimbursement of ‘out of pocket expenses’. |
References
Australian Government 2022, Final Budget Outcome 2021-22, Part 3: Australia's Federal Financial Relations.
Impact of COVID-19 on data for the Emergency services for fire and other events section
COVID-19 may affect data in this Report in a number of ways. This includes in respect of actual performance (that is, the impact of COVID-19 on service delivery from 2020 to 2022 which is reflected in the data results), and the collection and processing of data (that is, the ability of data providers to undertake data collection and process results for inclusion in the Report).
A PDF of Part D Emergency management can be downloaded from the Part D sector overview page.