Report on Government Services 2023
PART G, SECTION 18: LATEST UPDATE: 6 JUNE 2023
18 Housing
LATEST UPDATE 6 JUNE 2023:
Indigenous community housing data in indicator results for:
Indigenous community housing data in context on:
This section presents data on the performance of governments in providing social housing, including public housing (PH), state owned and managed Indigenous housing (SOMIH), community housing (CH) and Indigenous community housing (ICH). The Indicator results tab uses data from the data tables to provide information on the performance for each indicator in the Indicator framework. The same data in the data tables are also available in CSV format.
As highlighted in the Report's performance indicator framework all the current indicators reported in this section have comparability and/or completeness issues. Consequently, caution is required when comparing across jurisdictions or within a jurisdiction over time. The commentary in this section and footnotes accompanying the relevant data tables outline the comparability and completeness issues.
Data downloads
- 18 Housing data tables (XLSX - 421 Kb)
- 18 Housing dataset (CSV - 748 Kb)
See the corresponding table number in the data tables for detailed definitions, caveats, footnotes and data source(s).
- Context
- Indicator framework
- Indicator results
- Indigenous data
- Explanatory material
Objectives for social housing
Social housing services aim to provide low income people who do not have alternative suitable housing options with access to social housing assistance that supports their social and economic participation and their wellbeing. The social housing services system seeks to achieve these aims through the provision of services that are:
- timely and affordable
- safe
- appropriate, meeting the needs of individual households
- high quality
- sustainable.
Governments aim for social housing services to meet these objectives in an equitable and efficient manner.
Service overview
Social housing is subsidised rental housing provided by not-for-profit, non-government or government organisations to assist people who are unable to access suitable accommodation in the private rental market. Four forms of social housing are reported in this section.
Forms of social housing
- Public housing: dwellings owned (or leased) and managed by State and Territory housing authorities. Public housing is generally accessed by people on low incomes and/or those in selected equity groups, and aims to provide a choice of housing location, physical type and management arrangements.
- State owned and managed Indigenous housing (SOMIH): dwellings owned and managed by State and Territory housing authorities that are allocated only to Aboriginal and Torres Strait Islander tenants, including dwellings managed by government Indigenous housing agencies.
- Community housing: rental housing provided to low-to-moderate income households and/or those in selected equity groups, managed by community-based organisations that lease properties from government or have received a capital or recurrent subsidy from government. Community housing organisations typically receive some form of government assistance, such as direct funding for the provision of land and property, but a number of community housing organisations are entirely self-funded. The key terms section on the Explanatory materials tab provides further information on different models of community housing.
- Indigenous community housing (ICH): dwellings owned or leased and managed by ICH organisations and community councils. ICH models vary across jurisdictions and can also include dwellings funded, managed or registered by government. ICH organisations include community organisations such as resource agencies and land councils.
Crisis and transitional housing is another form of social housing but cannot be separately identified in this Report. Some crisis and transitional housing may be indirectly reported as forms of social housing in this Report.
Roles and responsibilities
From 1 July 2018, social housing is funded and delivered under the National Housing and Homelessness Agreement (NHHA) and related Partnership Agreements between the Australian Government and State and Territory governments. These services were previously funded under the National Affordable Housing Agreement and related Agreements. This section does not report on housing programs provided outside the NHHA (for example, those provided by the Department of Veterans’ Affairs or rental or home purchase assistance — the latter is discussed in sector overview G).
State and Territory governments have primary responsibility for delivering social housing services either directly through public housing and SOMIH or through funding community housing providers. ICH is generally managed by ICH organisations (although some ICH dwellings are managed by State and Territory housing authorities). State and Territory governments assumed responsibility for administering ICH in urban and regional areas, however arrangements varied across jurisdictions.
Funding
State and Territory government net recurrent expenditure on social housing was $4.6 billion in 2021‑22, unchanged in real terms from 2020‑21. In 2021‑22, this expenditure included $3.2 billion for public housing and $200.6 million for SOMIH (table 18.1).
Australian Government funding for services under the NHHA and related agreements was $1.7 billion in 2021‑22 (see table GA.1 in the Housing and Homelessness Sector Overview) and is included in total State and Territory government net recurrent expenditure for housing and homelessness services. State and Territory government capital (non‑recurrent) expenditure for social housing was $2.7 billion in 2021‑22 (table 18A.1).
Size and scope
Nationally at 30 June 2022, there were 417 966 households and 439 874 social housing dwellings (tenancy rental units for community housing and permanent dwellings for ICH) (figure 18.1).
While the number of public housing households has decreased over the past decade (321 213 in 2013 to 286 014 in 2022), there has been an increase in the number of households in community housing, from 65 632 to 102 145 (table 18A.4). This in part reflects transfer of some public housing stock (management and/or title) to the community housing sector (table 18A.2), in line with government policy to expand the role of community housing in the provision of affordable housing. Community housing organisations are working in partnership with the Australian, State and Territory governments, and the private sector, to increase the supply of affordable housing — many new social housing dwellings are or will be owned and/or managed by community housing organisations.
Some forms of community housing allow tenants to participate in the management of their housing. Notwithstanding their common objectives, community housing programs vary within and across jurisdictions in their administration and the types of accommodation they provide. See Key Terms in the Explanatory material tab for details on community housing models.
Diversity of State and Territory government social housing
While State and Territory governments have similar broad objectives for providing social housing, the emphasis each jurisdiction places on an individual objective differs depending on historical precedents and processes for interaction with community sector providers. Private housing markets also vary across jurisdictions. Accordingly, policy responses and associated forms of assistance vary across jurisdictions. When analysing performance information, it is important to consider the different levels and types of assistance provided in each jurisdiction, their different urban, regional and remote area concentrations (tables 18A.5–7), differences in eligibility criteria for housing assistance types and factors affecting waiting lists. Some information on the context for public housing, SOMIH and community housing is provided in tables 18.2–4.
Eligibility criteria for access to social housing
Eligibility criteria for social housing vary across social housing types and jurisdictions.
- Public housing — in most cases, jurisdictions require that applicants are Australian citizens or permanent residents and do not own or partially own residential property. All jurisdictions, except Victoria, require eligible applicants to reside in the respective State or Territory. Most jurisdictions provide security of tenure after an initial probationary period and most jurisdictions have periodic reviews of eligibility (table 18.2).
- SOMIH — criteria are generally consistent with those for public housing once an applicant has been confirmed as Aboriginal and/or Torres Strait Islander. Terms of tenure for SOMIH are the same as those for public housing in most jurisdictions (table 18.3).
- Community housing — criteria are generally consistent with those for public housing in each jurisdiction (table 18.4).
Tables 18.2 – 18.4
Factors affecting waiting lists
State and Territory governments prioritise access to social housing in ways that generally reflect the urgent need to address homelessness and applicants’ inability to access appropriate private market accommodation (AIHW 2022a). All states and territories have adopted social housing waiting lists that are integrated across public housing, SOMIH (where applicable) and community housing.
Time waited for social housing is impacted by the availability of suitable dwellings. Nationally at 30 June 2022, the proportion of rental stock occupied was 96.6 per cent for public housing, 94.7 per cent for SOMIH, 95.3 per cent for community housing and 94.3 per cent for ICH (tables 18A.10–13). Occupancy rates are influenced by tenancy turnover as well as by housing supply and demand — dwellings that have, for example, reached the end of their useful life may require major redevelopment or replacement before being allocated to a new household.
‘Turnaround time’ is the number of days taken to allocate a newly vacated dwelling (that is fit for occupation) to a new household. The average turnaround time for vacant public housing and SOMIH stock varied within and across jurisdictions and over time (tables 18A.14-15) — noting that data are not comparable or complete across jurisdictions.
The performance indicator framework provides information on equity, effectiveness and efficiency, and distinguishes the outputs and outcomes of social housing services.
The performance indicator framework shows which data are complete and comparable in this Report. For data that are not considered directly comparable, text includes relevant caveats and supporting commentary. Section 1 discusses data comparability and completeness from a Report-wide perspective. In addition to the contextual information for this service area (see Context tab), the Report’s statistical context (section 2) contains data that may assist in interpreting the performance indicators presented in this section.
Improvements to performance reporting for social housing services are ongoing and include identifying data sources to fill gaps in reporting for performance indicators and measures, and improving the comparability and completeness of data.
Outputs
Outputs are the services delivered (while outcomes are the impact of these services on the status of an individual or group) (see section 1). Output information is also critical for equitable, efficient and effective management of government services.
Outcomes
Outcomes are the impact of services on the status of an individual or group (see section 1).
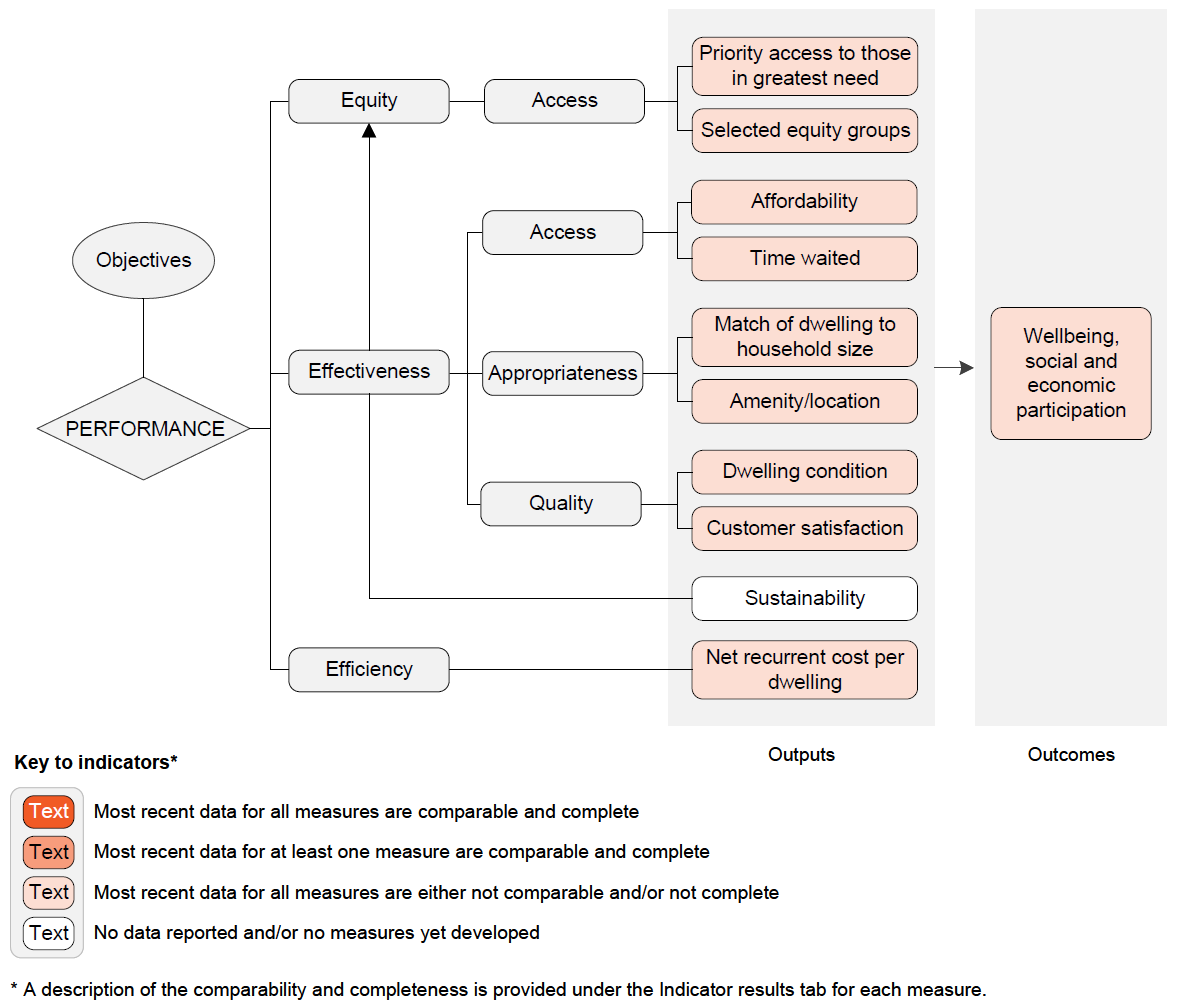
Text version of indicator framework
Performance — linked to Objectives
Outputs
- Equity — Access
- Priority access to those in greatest need – most recent data for all measures are either not comparable and/or not complete
- Selected equity groups – most recent data for all measures are either not comparable and/or not complete
- Effectiveness — Access
- Affordability – most recent data for all measures are either not comparable and/or not complete
- Time waited – most recent data for all measures are either not comparable and/or not complete
- Effectiveness — Appropriateness
- Match of dwelling to household size – most recent data for all measures are either not comparable and/or not complete
- Amenity/location – most recent data for all measures are either not comparable and/or not complete
- Effectiveness — Quality
- Dwelling condition – most recent data for all measures are either not comparable and/or not complete
- Customer satisfaction – most recent data for all measures are either not comparable and/or not complete
- Effectiveness
- Sustainability – no data reported and/or no measures yet developed
- Efficiency
- Net recurrent cost per dwelling – most recent data for all measures are either not comparable and/or not complete
Outcomes
- Wellbeing, social and economic participation – most recent data for all measures are either not comparable and/or not complete
A description of the comparability and completeness is provided under the Indicator results tab for each measure.
This section presents an overview of 'Housing' performance indicator results. Different delivery contexts, locations and types of clients can affect the equity, effectiveness and efficiency of social housing services.
Information to assist the interpretation of these data can be found with the indicators below and all data (footnotes and data sources) are available for download above as an excel spreadsheet and as a CSV dataset. Web references to the AIHW data quality statements for each social housing collection are available in the relevant data table. Data tables are identified by a ‘18A’ prefix (for example, table 18A.1).
Specific data used in figures can be downloaded by clicking in the figure area, navigating to the bottom of the visualisation to the grey toolbar, clicking on the 'Download' icon and selecting 'Data' from the menu. Selecting 'PDF' or 'Powerpoint' from the 'Download' menu will download a static view of the performance indicator results.
1. Priority access to those in greatest need
‘Priority access to those in greatest need’ is a proxy indicator of governments’ objective to provide services in an equitable manner.
‘Priority access to those in greatest need’ is defined as the proportion of new housing allocations that were to households in greatest need.
Greatest need households are defined as households that at the time of allocation are homeless, in housing inappropriate to their needs, in housing that is adversely affecting their health or placing their life and safety at risk, or, have very high rental housing costs.
This is a partial proxy indicator as information is not provided about the proportion of households on the waiting list that are ‘greatest need’ households. Households that are in greatest need are more likely to have members in selected equity groups, and there may be overlap between selected equity groups and greatest need groups (AIHW 2022a). A high or increasing proportion, particularly for short timeframes, may indicate a high degree of access for those households in greatest need.
Nationally in 2021-22, 83.0 per cent of new public housing allocations, 79.4 per cent of new SOMIH allocations and 76.8 per cent of new community housing allocations were to households in greatest need (figure 18.2a). Data by jurisdiction are available in figure 18.2b.
2. Access of selected equity groups
'Access of selected equity groups’ to social housing is an indicator of governments’ objective to provide services in an equitable manner.
‘Access of selected equity groups’ is defined as the proportion of new housing allocations that were to households in selected equity groups.
Selected equity group households are defined as households that at the time of allocation have:
- for public housing and community housing — a household member with disability, a main tenant aged 24 years or under, a main tenant aged 75 years or over, and/or satisfy the Aboriginal and Torres Strait Islander household definition
- for SOMIH — a household member with disability, a principal tenant aged 24 years or under and/or a principal tenant aged 50 years or over.
The proportion of new tenancies in selected equity groups is reported as a proxy for measuring all households in selected equity groups. A high or increasing proportion indicates high or increasing access by households in selected equity groups.
Nationally in 2021-22, the proportion of new tenancies allocated to households in selected equity groups was 62.4 per cent for public housing, 46.5 per cent for SOMIH and 58.9 per cent for community housing (figure 18.3a). Data by jurisdiction are available in figure 18.3b.
3. Affordability
‘Affordability’ is an indicator of governments’ objective to provide services that are affordable.
‘Affordability’ is defined as the financial capacity of low–income households in social housing to meet rental costs. It is measured as the proportion of low–income social housing households in rental stress, where:
- ‘rental stress’ is defined as spending more than 30 per cent of gross household income (excluding CRA) on rent
- low–income households are defined as those in the bottom 40 per cent of equivalised gross household income (see section 18.3 for further detail). Low–income households are more likely to be adversely affected by relatively high housing costs than households with higher disposable incomes (Yates and Gabriel 2006; Yates and Milligan 2007).
Rental stress is mitigated through rental subsidies provided to eligible low–income social housing households by State and Territory governments. For public housing and SOMIH, rents are generally set at estimated market rates and subsidised for eligible households so that rental costs do not exceed a set proportion of assessable household income (25 per cent in most states and territories).
A low or decreasing proportion of social housing households spending more than 30 per cent of their income on rent implies that social housing is more affordable.
Nationally at 30 June 2022, the majority of households in social housing were low income households. The proportion of low income social housing households in rental stress was 0.4 per cent for public housing, 0.4 per cent for SOMIH and 3.9 per cent for community housing (table18.5).
4. Time waited
‘Time waited’ is an indicator of governments' objective to provide services that are timely.
‘Time waited’ is defined as the time waited by households that are newly allocated social housing in the reference year, and is reported for two household types:
- households in greatest need — time waited is measured from acceptance as a household in greatest need onto a social housing wait list and allocation of a dwelling
- non-greatest need households — time waited is measured from acceptance onto a social housing wait list and allocation of a dwelling.
Households in greatest need are defined as households that at the time of allocation are: homeless; in housing inappropriate to their needs; in housing that is adversely affecting their health or placing their life and safety at risk; or, have very high rental housing costs.
Time waited is presented as:
- the number of months within which 50 percent of newly allocated households were allocated a dwelling (the 50th percentile, or median). For example, if the 50th percentile is 7 months, 50 per cent of newly allocated households waited 7 months or less
- the number of months within which 75 percent of newly allocated households were allocated a dwelling (the 75th percentile). For example, if the 75th percentile is 12 months, 75 per cent of newly allocated households waited 12 months or less.
Households awaiting social housing allocation may receive other forms of government assistance to obtain or maintain housing: for example, Private Rent Assistance, homelessness services and/or Commonwealth Rent Assistance.
This indicator should be interpreted with caution. Factors external to government can drive changes in performance. Demand for social housing reflects the capacity of low income earners to access and maintain affordable housing in the private market. Rising rents or house prices and low wages growth can lead to rises in demand.
Governments can use a range of interventions to improve access to affordable housing for low income earners, thereby reducing demand for social housing. For example, stimulating new supply of affordable housing, incentives to increase affordability of existing housing and targeted financial assistance to low income earners.
Time waited for social housing reflects the collective impact of external factors and governments’ actions to address the need for affordable and social housing.
Time waited is also affected by differences across jurisdictions in social housing supply, allocation policy and waitlist management.
A low or decreasing time waited is desirable.
Nationally in 2021-22, 50 per cent of newly allocated households in public housing were allocated a dwelling within 7 months; 75 per cent were allocated a dwelling within 27 months.
Nationally in 2021-22, 50 per cent of newly allocated households in SOMIH were allocated a dwelling within 5 months; 75 per cent were allocated a dwelling within 20 months.
5. Match of dwelling to household size
‘Match of dwelling to household size’ is an indicator of governments’ objective to provide services that are appropriate, meeting the needs of individual households.
‘Match of dwelling to household size’ is defined as the proportion of households that are overcrowded.
Overcrowding is defined and measured using the Canadian National Occupancy Standard (CNOS), with households deemed to be overcrowded if one or more additional bedrooms are required to meet the standard (see sub–section 18.3 for CNOS definition). State and Territory housing authorities’ bedroom entitlement policies may differ from the CNOS.
The CNOS requires knowledge of the age, sex and relationship status of all tenants within a household, as well as the number of bedrooms. Households for which complete information is not available are excluded from data for this measure.
Low or decreasing proportions of households in social housing living in overcrowded conditions are desirable.
Nationally at 30 June 2022, the proportion of households that were overcrowded varied across social housing programs (4.5 per cent for public housing, 26.2 per cent for SOMIH, 3.6 per cent for community housing and 14.1 per cent for ICH.)
Data for Aboriginal and Torres Strait Islander households are in table 18A.34 and, by remoteness for public housing and SOMIH, in tables 18A.35-36. Data for underutilisation in public housing, SOMIH and community housing dwellings are reported in table 18A.37.
6. Amenity/location
‘Amenity/location’ is an indicator of governments’ objective to provide services that are appropriate, meeting the needs of individual households.
‘Amenity/location’ is defined as the proportion of households that rate dwellings as meeting their needs for particular aspects of amenity and location, and is presented as a mean of the proportion of households with needs met across (a) dwelling amenity aspects and (b) dwelling location aspects.
‘Amenity’ aspects include: number of bedrooms, privacy, safety and security — of the home, and of the neighbourhood — comfort in hot/cold weather and energy efficiency. Amenity aspects also include, for households rating them as important: size of living spaces, storage, fixtures/structural modifications for special needs, ease of access/entry from the street, car parking, access to an outdoor space, fencing/enclosure of the space, and water efficiency of the bathroom/toilet.
‘Location’ aspects include proximity to shops and banking facilities, medical services and family and friends. ‘Location’ aspects also include, for households rating them as important, proximity to facilities and services such as: public transport, hospitals, child care facilities, schools, TAFE, university or other training, employment/place of work, community services and parks, recreation or sporting facilities.
High or increasing proportions of households with amenity and location needs met are desirable.
Nationally in 2021, the majority of National Social Housing Survey respondents rated amenity and location aspects of their dwelling as meeting their household’s needs (table 18.8 and figure 18.6).
Amenity and location data for households with a member with disability are available in tables 18A.38–40.
7. Dwelling condition
‘Dwelling condition’ is a proxy indicator of governments’ objective to provide services that are high quality and safe.
‘Dwelling condition’ is defined as the proportion of households living in dwellings that meet agreed minimum acceptable standards. A dwelling is assessed as meeting minimum acceptable standards if it has at least four working facilities (for washing people, for washing clothes/bedding, for storing/preparing food, and for removing sewerage) and not more than two major structural problems.
This is a proxy indicator of safety as it measures the extent to which dwellings conform to agreed minimum standards. The survey collections ask respondents:
- which of a list of facilities is present in their dwelling and whether each is in working order
- which of a list of structural problems is present in their dwelling (AIHW 2022b).
A high or increasing proportion of households living in dwellings that meet minimum acceptable standards suggests a low or decreasing risk of harm from poor dwelling condition.
Nationally in 2021 (where data are available), while the majority of social housing respondents lived in dwellings of an acceptable standard (76.0 per cent for public housing, 63.7 per cent for SOMIH and 81.9 per cent for community housing), the proportions have decreased 4–10 percentage points from 2018 (table 18.9 and figure 18.7).
Historical Indigenous community housing data are available in table 18A.44.
8. Customer satisfaction
‘Customer satisfaction’ is an indicator of governments’ objective to provide services that are high quality.
‘Customer satisfaction’ is defined as the proportion of social housing survey respondents who indicated they were satisfied or very satisfied with the overall service provided by their housing provider.
A high or increasing level of customer satisfaction is desirable.
Customer satisfaction data for households with a member with disability are available in tables 18A.45–47.
Nationally in 2021 (where data are available), the majority of social housing respondents were satisfied with the overall service provided by their housing provider (71.9 per cent for public housing, 64.5 per cent for SOMIH, and 76.4 per cent for community housing) (table 18.10 and figure 18.8a). Data by jurisdiction are available in figure 18.8b.
9. Sustainability
‘Sustainability’ is an indicator of government’s objective to provide services that are sustainable.
‘Sustainability’ is broadly defined as the extent to which current social housing needs are met with reference to the need for future generations to meet their own social housing needs. In its broadest sense, this could consider financial, social and environmental sustainability.
Further development of this indicator concept and potential measure(s) will be considered with reference to the policy environment.
10. Net recurrent cost per dwelling
‘Net recurrent cost per dwelling’ is an indicator of governments’ objective to provide services in an efficient manner.
‘Net recurrent cost per dwelling’ is defined as the cost of providing assistance per dwelling and is measured as total net recurrent expenditure divided by the total number of dwellings.
Data are reported for public housing, SOMIH, community housing and ICH. Net recurrent cost per dwelling for public housing and for SOMIH for 2017‑18 and subsequent years is reported with user cost of capital both included and excluded. User cost of capital data are not available for SOMIH prior to 2017‑18, nor for community housing or ICH. For ICH, total number of dwellings is the number of permanent dwellings.
An inconsistency between numerator and denominator with a deflationary effect on community housing cost per dwelling may result from transfer of management responsibility for some public housing and/or SOMIH stock to the community sector, which is underway in some jurisdictions and planned to occur progressively over time in most others. The denominator (number of community housing dwellings at 30 June) may include dwellings for which expenditure for only part of the reporting year is counted in the numerator. This inconsistency is not expected to apply for public housing and SOMIH as the denominator (the average of the number of dwellings for each month of the reporting year) largely accounts for transfer of dwellings to the community sector.
Care needs to be taken in interpreting the cost of delivering social housing. Data are not comparable across jurisdictions as jurisdictions vary in how completely costs are captured and how consistently data are collected, as well as the degree to which costs can be separated between different models of social housing and homelessness services. There is also potential for double counting — for example, some of the user cost of capital may also be included in operating costs.
The user cost of capital is the cost of the funds tied up in the capital used to provide social housing. User cost of capital is the main driver of cost per dwelling due to the level of capital expenditure on housing. Data should be interpreted with caution due to variation across jurisdictions in the treatment of assets (table 18.13) and service delivery models.
Holding other factors — such as dwelling condition and tenant support services — equal, a low or decreasing cost per dwelling is desirable.
Nationally in 2021-22, the net recurrent cost per dwelling excluding user cost of capital (UCC) was $10 655 for public housing ($46 339 if UCC included), $13 982 for SOMIH ($50 647 if UCC included) and $13 195 for ICH. Nationally in 2020-21, the net recurrent cost per dwelling excluding UCC was $9256 for community housing (table 18.11). Ten-year time series data are available for public housing and SOMIH in tables 18A.48-49. A nine-year time series is reported for community housing in table 18A.50 and a six-year time series for ICH in table 18A.51. Data by jurisdiction are available in figure 18.9.
11. Wellbeing, social and economic participation
‘Wellbeing, social and economic participation’ is an indicator of governments’ objective to provide services that support wellbeing and contribute to social and economic participation.
Living in stable, safe and secure housing has many benefits, including improved household wellbeing and greater capacity to participate in social and economic activity (Brackertz et al., 2017, Davison et al., 2021). These benefits can accrue to people living in social housing as well as people living in private housing.
‘Wellbeing, social and economic participation’ is defined as the proportion of social housing tenants who self‑report that they experience wellbeing, social connection and economic participation opportunities through living in social housing.
Data are sourced from the National Social Housing Survey (NSHS), which asks tenants ‘For you, what are the benefits of living in social housing’. Tenants are asked to select ‘Yes, it is a benefit’, ‘No, it is not a benefit’ or ‘Not applicable’ for each of ten nominated benefits. Composites of the nominated benefits are reported as:
- ‘Wellbeing’ (‘enjoy better health’, ‘feel more settled’ and ‘feel more able to cope with life events’)
- ‘Social connection’ (‘feel part of the local community’ and ‘able to continue living in this area’)
- ‘Economic participation opportunities’ (‘able to manage rent/money better’, ‘feel more able to improve job situation’, ‘feel more able to start or continue education/training’, ‘have better access to services’ and ‘have better access to public transport’).
The 2021 NSHS was conducted among public housing tenants (all jurisdictions), community housing (all jurisdictions except the NT) and state owned and managed Indigenous housing (SOMIH [NSW, Queensland, SA and Tasmania]). For more information on response rates, sampling error and survey coverage, see the NSHS data quality statement on the AIHW website.
A high or increasing proportion of social housing tenants self-reporting that they experience health, social and economic benefits through living in social housing is desirable.
Data for households with a member with disability are available in tables 18A.52–54.
Nationally in 2021 (where data are available), the majority of social housing respondents self-reported that they experienced wellbeing, social connection and economic participation opportunities through living in social housing (table 18.12 and figure 18.10). For all households across each social housing type and composite benefit (‘wellbeing’, ‘social connection’ and ‘economic participation’), between 93.2 and 98.3 per cent of respondents reported deriving a benefit from living in social housing. The most common benefits derived were feeling more settled (94.6–95.9 per cent) and being able to manage rent/money better (92.8–94.2 per cent). The least common benefit derived was feeling more able to improve their job situation (65.5–79.3 per cent) (tables 18A.52–54).
Performance indicator data for Aboriginal and Torres Strait Islander people in this section are available in the data tables listed below. Further supporting information can be found in the Indicator results tab and data tables.
| Table number | Table title |
|---|---|
| Table 18A.17 | Greatest need allocations as a proportion of all new allocations — SOMIH |
| Table 18A.20 | Proportion of new tenancies allocated to households in selected equity groups — SOMIH |
| Table 18A.24 | Proportion of household gross income spent on rent — low income households in SOMIH, at 30 June |
| Table 18A.31 | Proportion of overcrowded households at 30 June — SOMIH |
| Table 18A.33 | Proportion of overcrowded households at 30 June — Indigenous community housing |
| Table 18A.34 | Aboriginal and Torres Strait Islander households living in overcrowded conditions, by housing program |
| Table 18A.35 | Proportion of Aboriginal and Torres Strait Islander households in public housing living in overcrowded conditions, by remoteness |
| Table 18A.36 | Proportion of Aboriginal and Torres Strait Islander households in SOMIH living in overcrowded conditions, by remoteness |
| Table 18A.37 | Underutilisation in social housing at 30 June |
| Table 18A.39 | Proportion of SOMIH tenants rating amenity and location aspects as important and meeting their needs, 2021 |
| Table 18A.42 | Dwelling condition, SOMIH |
| Table 18A.44 | Dwelling condition, Indigenous community housing |
| Table 18A.46 | Customer satisfaction — SOMIH |
| Table 18A.49 | Government recurrent expenditure per dwelling, SOMIH, 2021-22 dollars |
| Table 18A.51 | Government recurrent expenditure per dwelling, Indigenous community housing, 2021-22 dollars |
| Table 18A.53 | Self-reported benefits of living in social housing – SOMIH |
Interpreting efficiency data
NSW | Vicc | Qldd | WA | SA | Tas | ACT | NTe | ||
|---|---|---|---|---|---|---|---|---|---|
Revaluation method | Land | Vacant land (with registered title) and land held for redevelopment based on Valuer general property information in the rating and taxation purposes valuation database. | Fair value | Fair value (in accordance with AASB13) | Fair value (in accordance with AASB13) | Market | Net | Fair value (in accordance with AASB13) | Market Value (public housing); Nil (SOMIH) |
Buildings | Fair value determined by applying an annual rolling benchmark valuation approach whereby a third of the Corporation’s benchmark properties (approx. 1800) are valued by accredited property valuers with reference to market sales comparisons to calculate a market movement index, which is then applied to the remaining two thirds of the benchmark properties. | Fair value | Fair value (in accordance with AASB13) | Fair value (in accordance with AASB13) | Market | Net | Fair value (in accordance with AASB13) | Market Value (public housing); Historical Replacement Cost (SOMIH) | |
Other assets | Based on historical cost and not revalued each year. | Fair value | At cost | At cost | Historical cost | .. | Historical cost | Historical Cost (public housing); Historical Replacement Cost (SOMIH) | |
Revaluation frequency | Annual | 5 yearly intervals (interim assessments by indices between intervals) | Annual | Annual | Annual | Annual | Annual | Annual | |
Useful asset lives | Residential properties | 50 years | 85 years (but moveable units is 45 years) | 50 years (2 per cent straight line depreciation) | 50 years | 50 years | 50 years | up to 80 years | 50 years (public housing); 30 years (SOMIH) |
Vehicles | 3 years | 5–10 years | .. | 6 years and 8 months | .. | 5 years | 3–5 years | 2 years | |
Office equipment | 3 years | 3–5 years | 2–15 years (7–46 per cent straight line depreciation) | 5 years | 10 years | 3 years | .. | 5–10 years | |
IT equipment | 3 years | 3–5 years | 2–15 years (7–46 per cent straight line depreciation) | 5 years | 3 years | 3 years | .. | 3–6 years | |
Threshold capitalisation levels | $5000 | $5000 | Buildings: $10 000; Land: $1; Plant and equipment: $5000; Right–of–use assets: $10 000; Computer software: $100 000 | $5000 | $5000 | $10 000 | $2 000 | Buildings: $10 000; Land $10 000 (PH); Plant and equipment: $10 000 | |
Assets capitalised individually or in groups | Individually | Individually | Individually | Individually | Individually | Individually | Individually | Individually | |
a .. Not applicable. b Market value is the current (net) value market selling price or exchange value. c Victoria revalues properties every 5 years by kerbside inspection, with the most recent revaluation completed in 2018‑19. In interim years, asset value movements are assessed based on indices — if found to be material (>10 per cent), a Managerial Revaluation is undertaken, and, if found to be exceptionally material (>= 40 per cent), an Interim Valuation is undertaken. d Useful asset life for leased assets: 40 years (2.5 per cent straight line depreciation). e SOMIH dwellings are in remote areas on land not owned by government.
Source: State and Territory governments (unpublished).
| Jurisdiction | Program |
|---|---|
NSW |
Note: Assistance type and property source are independent of each other and numerous combinations of the two apply |
Vic |
|
Qld |
|
WA |
|
SA |
|
Tas |
Note that this scope includes community housing that both is and is not funded by government |
ACT |
|
NT |
|
Source: AIHW (unpublished).
Key terms
| Terms | Definition |
|---|---|
Aboriginal and Torres Strait Islander household | A household with one or more members (including children) who identify as Aboriginal and/or Torres Strait Islander. |
Administration costs | Those costs associated with the administration offices of the property manager and tenancy manager. They include the general accounting and personnel function costs relating to:
|
Assessable income | The income used to assess eligibility for housing assistance and to calculate the rental housing rebate that allows a household to pay a rent lower than the market rent. The components of income that are counted as assessable may vary across jurisdictions. |
Canadian National Occupancy Standard (CNOS) | A standardised measure of housing utilisation and overcrowding. This measure assesses a household’s bedroom requirements by specifying that:
|
Comparability | Data are considered comparable if (subject to caveats) they can be used to inform an assessment of comparative performance. Typically, data are considered comparable when they are collected in the same way and in accordance with the same definitions. For comparable indicators or measures, significant differences in reported results allow an assessment of differences in performance, rather than being the result of anomalies in the data. |
Completeness | Data are considered complete if all required data are available for all jurisdictions that provide the service. |
Confidence intervals | Survey data, for example data from the NSHS, are subject to sampling error because they are based on samples of the total population. Where survey data are shown in charts in this report, error bars are included, showing 95 per cent confidence intervals. There is a 95 per cent chance that the true value of the data item lies within the interval shown by the error bars. |
Depreciation costs | Depreciation calculated on a straight line basis at a rate that realistically represents the useful life of the asset (as per the Australian Accounting Standards 13–17). |
Disability | Households with a member with disability are defined as households in which at least one member always or sometimes needs assistance with self–care activities, body movement activities or communication, and the reason for needing assistance is either ‘long–term health condition lasting six months or more’ or ‘disability’. |
Dwelling | A structure or a discrete space within a structure intended for people to live in or where a person or group of people live. Thus, a structure that people actually live in is a dwelling regardless of its intended purpose, but a vacant structure is a dwelling only if intended for human residence. A dwelling may include one or more rooms that is/are used as an office or workshop, provided the dwelling is in residential use. Dwelling types include:
|
Equivalisation | See low–income households entry. |
Greatest need | Applies to households if, at the time of allocation, household members were subject to one or more of the following circumstances:
a A homeless household for the greatest need definition is a household with no housing or a household residing in temporary or emergency accommodation. It includes households who:
|
Household | The grouping of people living in a dwelling. Household composition is based on couple and parent–child relationships. A single–family household contains a main tenant only, or a main tenant residing with a partner and/or the main tenant’s children. Group households consist of 2 or more tenants aged 16 or over who are not in a couple or parent–child relationship. Mixed households are households not described by the other two types — for example, multiple single–family households. For the purpose of the community housing collection, the number of tenancy agreements is the proxy for counting the number of households. A tenancy agreement is defined as a formal written agreement between a household (a person or group of people) and a housing provider, specifying details of a tenancy for a particular dwelling. |
Low–income households | For the purpose of social housing affordability analyses, ‘low–income households’ are defined as those in the bottom 40 per cent of equivalised gross household income. (Different definitions of low–income households are used for different purposes by the ABS and others.) Equivalisation Increased household size is associated with increased consumption needs, but also with economies of scale. An equivalence scale is used to adjust household incomes to take account of the economies that flow from sharing resources, enabling more meaningful comparisons across different types of households. The ABS provides low–income household equivalised gross income cut–offs derived from the biennial Survey of Income and Housing data to the AIHW. The AIHW determines the equivalised gross household income for social housing households for affordability analyses. Note that equivalised gross household income is not used to determine eligibility for social housing or rental subsidies (see ‘assessable income’). |
Maintenance costs | Costs incurred to maintain the value of the asset or to restore an asset to its original condition. The definition includes day–to–day maintenance reflecting general wear and tear, cyclical maintenance, performed as part of a planned maintenance program and other maintenance, such as repairs as a result of vandalism. |
Market rent | Rent that would be collected if the public rental housing properties were available in the private market. |
Models of community housing | Community housing models vary across jurisdictions in scale, organisational structure and financing arrangements, and the extent to which community organisations or government have management responsibility and ownership of the housing stock. Table 18.5 lists the in–scope community housing programs in each jurisdiction. Some models of community housing are:
|
New household | Households that commence receiving assistance during the relevant reporting period (financial year). A new household is recorded if the composition of the household changes i.e. if someone enters or leaves the household. |
Occupancy rate | The number of dwellings occupied as a proportion of total dwellings. |
Occupied dwelling | Dwellings occupied by tenants who have a tenancy agreement with the relevant housing authority. |
Overcrowding | A situation in a dwelling when one or more additional bedrooms are required to meet the Canadian National Occupancy Standard. |
Principal tenant | The person whose name appears on the tenancy agreement. Where this is not clear, it should be the person who is responsible for rental payments. |
Rebated household | A household that receives housing assistance and pays less than the market rent value for the dwelling. |
Remoteness areas | An aggregation of non–continuous geographical areas that share common characteristics of remoteness. The delimitation criteria for remoteness areas (RAs) are based on the Accessibility/Remoteness Index for Australia (ARIA+), which measures the remoteness of a point based on the road distance to the nearest urban centre. Within the Australian Statistical Geography Standard, each RA is created from a grouping of Statistical Areas Level 1 having a particular degree of remoteness. Remoteness areas comprise the following six categories:
|
Rent charged | The amount in dollars that households are charged based on the rents they are expected to pay. The rents charged to tenants may or may not have been received. |
Tenancy (rental) unit | A tenancy (rental) unit is the unit of accommodation for which a rental agreement can be made. With the exception of community housing, dwellings in the majority of cases have only one tenancy (rental) unit. For community housing and a small number of other cases (for example, boarding houses, special group homes, semi–institutional dwellings), there is commonly more than one tenancy (rental) unit per dwelling. |
Tenantable dwelling | A dwelling where maintenance has been completed, whether occupied or unoccupied at 30 June. All occupied dwellings are tenantable. |
Total gross household income | The value of gross weekly income from all sources (before deductions for income tax, superannuation etc.) for all household members, expressed as dollars per week. The main components of gross income are current usual wages and salary; income derived from self–employment, government pensions, benefits and allowances; and other income comprising investments and other regular income. CRA payments are not included as income. |
Transfer household | A household, either rebated or market renting, that relocates (transfers) from one dwelling to another within the same social housing program. In the community housing data collection, a transfer household is a household that transfers within a single community housing organisation’s portfolio (not across the sector). This leads to under–reporting of transfers. |
Turnaround time | The average time taken in days for vacant dwellings, which are available for letting, to be occupied. |
Underutilisation | A situation where a dwelling contains two or more bedrooms surplus to the needs of the household occupying it, according to the Canadian National Occupancy Standard. |
Untenantable dwelling | A dwelling where maintenance has been either deferred or not completed at 30 June. |
References
AIHW (Australian Institute of Health and Welfare) 2022a, Housing assistance in Australia, https://www.aihw.gov.au/reports/housing-assistance/housing-assistance-in-australia/contents/entries-exits-and-transfers#Priority (accessed 14 October 2022)
—— 2022b, National Social Housing Survey: key results 2021, https://www.aihw.gov.au/reports/housing-assistance/national-social-housing-survey-2021/contents (accessed 18 November 2022).
Yates, J. and Gabriel, M. 2006, Housing Affordability in Australia, Research Paper No. 3, Australian Housing and Urban Research Institute, Melbourne.
Yates, J. and Milligan, V. 2007, Housing affordability: a 21st century problem, Final Report No. 105, Australian Housing and Urban Research Institute, Melbourne.
Impact of COVID-19 on data for the Housing section
COVID-19 may affect data in this Report in a number of ways. This includes in respect of actual performance (that is, the impact of COVID-19 on service delivery from 2020 to 2022 which is reflected in the data results), and the collection and processing of data (that is, the ability of data providers to undertake data collection and process results for inclusion in the Report).
For the Housing section, rent freezes in some jurisdictions in 2019-20 and 2020-21 due to the impacts of COVID-19 affected affordability indicator data. There were also decreased exits from social housing in all jurisdictions in 2019-20 and 2020-21, resulting in a decrease in new allocations and transfers and, in some jurisdictions, increases in waiting lists.
A PDF of Part G Housing and homelessness can be downloaded from the Part G sector overview page. Current as at 24 January 2023.