Report on Government Services 2017
Volume G, Chapter 18
Housing
This chapter presents data on the performance of governments in providing social housing, including public housing, State owned and managed Indigenous housing (SOMIH), community housing and Indigenous community housing.
The National Affordable Housing Agreement (NAHA) is the overarching agreement between Australian, State and Territory governments for providing assistance to improve housing outcomes for Australians.
Please note: An errata was released with this chapter. The files below have been updated to reflect the changes.
Download the chapter
- Chapter 18 Housing and attachment tables (PDF - 3368 Kb)
- Chapter 18 Attachment tables (XLSX - 7792 Kb)
- Key Facts
- Indicator Framework
- Indicator Results
- Indigenous Data
Nationally at 30 June 2016:
- Public housing — there were 312 219 households and 320 041 dwellings
- SOMIH — 9660 households and 9949 dwellings
- Community housing — 72 410 households and 80 225 community housing tenancy rental units
- in addition, there were 5046 remote social housing dwellings with approximately 21 865 residents located in the NT
There were 13 088 households and 15 643 permanent dwellings managed by government funded Indigenous community housing organisations at 30 June 2015.
The social housing services system aims to provide low income people who do not have alternative suitable housing options with access to social housing assistance that supports their wellbeing and contributes to their social and economic participation. Some forms of social housing aim specifically to contribute to Aboriginal and Torres Strait Islander community wellbeing through improved housing outcomes, particularly in remote areas and discrete communities. The social housing services system seeks to achieve these aims through the provision of services that are:
- timely and affordable
- safe
- appropriate, meeting the needs of individual households
- high quality
- sustainable.
Governments aim for social housing services to meet these objectives in an equitable and efficient manner.
The performance indicator framework provides information on equity, efficiency and effectiveness, and distinguishes the outputs and outcomes of social housing. The performance indicator framework shows which data are complete and comparable in the 2017 Report.
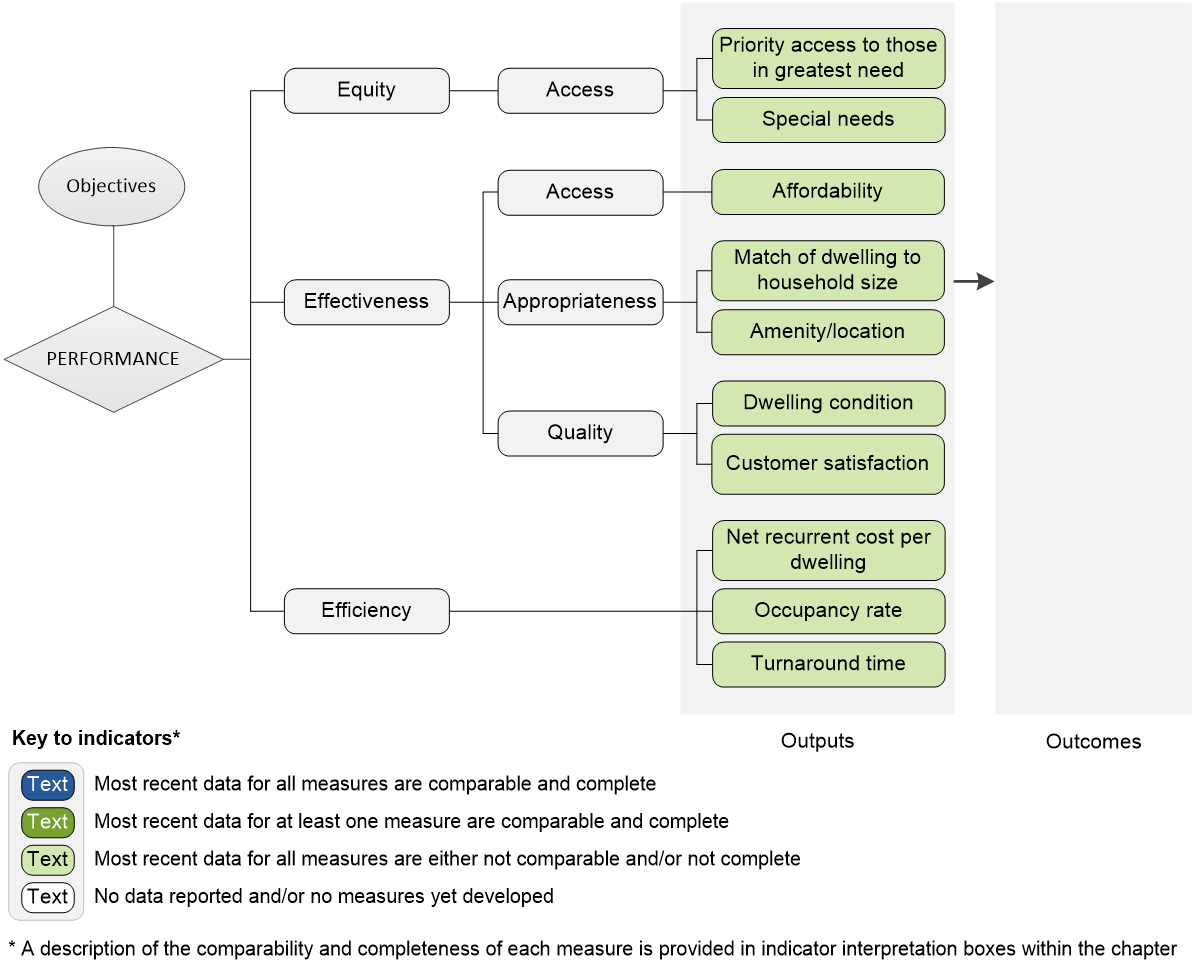
An overview of the Social housing performance indicator results are presented. Information to assist the interpretation of these data can be found in the indicator interpretation boxes in the Housing chapter and attachment tables.
Equity — Access indicators
Priority access to those in greatest need
Proportion of new housing allocations that were to households in greatest need, 2015-16 (%)
| NSW | Vic | Qld | WA | SA | Tas | ACT | NT | Aust | |
|---|---|---|---|---|---|---|---|---|---|
| PH | 51.7 | 83.8 | 96.9 | 67.3 | 86.5 | 91.3 | 96.8 | 57.3 | 75.1 |
| SOMIH | 20.6 | .. | 97.5 | .. | 91.2 | na | .. | .. | 57.7 |
| CH | 75.8 | 83.9 | 97.5 | 82.7 | 87.6 | 71.5 | 99.5 | na | 83.6 |
Special needs
Proportion of new tenancies allocated to households with special needs, 2015-16 (%)
| NSW | Vic | Qld | WA | SA | Tas | ACT | NT | Aust | |
|---|---|---|---|---|---|---|---|---|---|
| PH | 64.6 | 56.5 | 66.2 | 48.5 | 67.9 | 61.7 | 65.7 | 64.5 | 61.5 |
| SOMIH | 49.7 | .. | 45.2 | .. | 49.6 | 64.5 | .. | .. | 48.7 |
| CH | 64.8 | 49.1 | 68.1 | 48.9 | 52.1 | 79.9 | 52.4 | na | 59.4 |
Effectiveness — Access indicators
Affordability
Proportion of low income households spending more than 30 per cent of their gross income on rent, 2016 (%)
| NSW | Vic | Qld | WA | SA | Tas | ACT | NT | Aust | |
|---|---|---|---|---|---|---|---|---|---|
| PH | 0.7 | 0.4 | – | 2.9 | – | 0.1 | 0.3 | 3.5 | 0.7 |
| SOMIH | 0.3 | .. | 0.1 | .. | – | – | .. | .. | 0.2 |
| CH | 3.1 | – | 9.5 | 3.0 | 5.5 | 20.7 | 5.1 | na | 4.4 |
Source: Attachment table 18A.16
Effectiveness — Appropriateness indicators
Match of dwelling to household size
Proportion of overcrowded households, 2016 (ICH = 2015) (%)
| NSW | Vic | Qld | WA | SA | Tas | ACT | NT | Aust | |
|---|---|---|---|---|---|---|---|---|---|
| PH | 4.2 | 4.9 | 4.1 | 4.4 | 2.1 | 3.9 | 4.6 | 8.0 | 4.2 |
| SOMIH | 7.7 | .. | 11.8 | .. | 7.5 | 3.6 | .. | .. | 8.9 |
| CH | 9.4 | 3.3 | 1.7 | 1.6 | 2.3 | 3.3 | 0.9 | na | 5.3 |
| ICH | na | 5.1 | 24.5 | 16.3 | 33.2 | na | .. | na | na |
Source: Attachment tables 18A.23–26
Amenity/location
Proportion of households that rate selected aspects of amenity as important to their needs, who are in dwellings that meet those needs, 2016 (%)
| NSW | Vic | Qld | WA | SA | Tas | ACT | NT | Aust | |
|---|---|---|---|---|---|---|---|---|---|
| PH | 80.3 | 81.2 | 87.2 | 83.0 | 84.6 | 85.8 | 81.7 | 84.0 | 82.6 |
| SOMIH | 81.6 | .. | 84.4 | .. | 83.1 | 85.9 | .. | .. | 82.9 |
| ICH | 84.6 | 88.3 | 84.3 | 88.0 | 88.1 | 85.2 | 86.1 | na | 85.8 |
Source: Attachment tables 18A.30, 18A.32 and 18A.34.
Proportion of households that rate selected aspects of location as important to their needs, who are in dwellings that meet those needs, 2016 (%)
| NSW | Vic | Qld | WA | SA | Tas | ACT | NT | Aust | |
|---|---|---|---|---|---|---|---|---|---|
| PH | 87.1 | 89.0 | 89.9 | 91.2 | 90.9 | 92.0 | 89.5 | 88.6 | 89.0 |
| SOMIH | 92.7 | .. | 87.7 | .. | 92.8 | 93.6 | .. | .. | 90.9 |
| ICH | 88.8 | 92.8 | 90.7 | 91.4 | 91.4 | 88.5 | 92.2 | na | 90.2 |
Source: Attachment tables 18A.31, 18A.33 and 18A.35.
Effectiveness — Quality indicators
Dwelling condition
Proportion of households with at least four working facilities and not more than two major structural problems, 2016 (ICH = 2014-15) (%)
| NSW | Vic | Qld | WA | SA | Tas | ACT | NT | Aust | |
|---|---|---|---|---|---|---|---|---|---|
| PH | 74.8 ± 3.7 | 82.4 ± 3.3 | 86.8 ± 2.8 | 81.4 ± 3.0 | 85.2 ± 3.1 | 83.8 ± 2.8 | 81.5 ± 2.9 | 82.5 ± 3.0 | 80.7 ± 1.6 |
| SOMIH | 66.6 ± 4.2 | .. | 90.0 ± 2.6 | .. | 68.0 ± 5.1 | 83.5 ± 9.5 | .. | .. | 75.1 ± 2.4 |
| CH | 87.9 ± 2.7 | 90.0 ± 3.0 | 90.6 ± 3.0 | 90.7 ± 3.0 | 92.6 ± 2.2 | 82.4 ± 3.3 | 91.6 ± 3.8 | na | 88.8 ± 1.4 |
| ICH | 78.0 ± 9.5 | 83.6 ± 6.4 | 80.5 ± 23.2 | 74.9 ± 20.4 | 73.0 ± 8.5 | np | .. | 49.1 ± 4.1 | 71.4 ± 7.2 |
Source: Attachment tables 18A.36–39
Customer satisfaction
Proportion of tenants who were satisfied or very satisfied with the overall service provided by their housing provider, 2016 (%)
| NSW | Vic | Qld | WA | SA | Tas | ACT | NT | Aust | |
|---|---|---|---|---|---|---|---|---|---|
| PH | 61.7 ± 4.1 | 74.5 ± 3.7 | 85.8 ± 2.8 | 76.7 ± 3.2 | 82.7 ± 3.3 | 79.1 ± 3.0 | 74.8 ± 3.2 | 74.1 ± 3.4 | 73.1 ± 1.8 |
| SOMIH | 58.0 ± 4.4 | .. | 79.4 ± 3.5 | .. | 69.1 ± 5.0 | 75.0 ± 11.1 | .. | .. | 67.6 ± 2.6 |
| CH | 80.3 ± 3.2 | 82.1 ± 3.7 | 78.3 ± 4.2 | 85.1 ± 3.6 | 80.5 ± 3.6 | 79.9 ± 3.4 | 80.4 ± 5.4 | na | 80.3 ± 1.7 |
Source: Attachment tables 18A.40–42
Efficiency indicators
Net recurrent cost per dwelling
Net recurrent cost per dwelling, 2015-16 (CH and ICH = 2014-15) ($)
| NSW | Vic | Qld | WA | SA | Tas | ACT | NT | Aust | |
|---|---|---|---|---|---|---|---|---|---|
| PH | 8 455 | 6 415 | 8 281 | 12 567 | 9 806 | 8 498 | 9 847 | 13 883 | 8 766 |
| SOMIH | 8 939 | .. | 15 069 | .. | 11 570 | 7 557 | .. | .. | 11 424 |
| CH | 11 866 | 13 712 | 12 787 | 9 537 | 11 054 | 13 279 | 4 892 | na | 11 938 |
| ICH | 14 803 | 8 717 | 10 968 | 9 449 | na | 3 475 | .. | na | 10 865 |
Occupancy rates
Proportion of dwellings that are occupied, 2016 (ICH = 2015) (%)
| NSW | Vic | Qld | WA | SA | Tas | ACT | NT | Aust | |
|---|---|---|---|---|---|---|---|---|---|
| PH | 98.6 | 98.1 | 97.9 | 96.0 | 95.0 | 98.2 | 97.2 | 94.5 | 97.6 |
| SOMIH | 97.7 | .. | 96.7 | .. | 96.1 | 99.1 | .. | .. | 97.1 |
| CH | 83.4 | 94.7 | 95.5 | 93.6 | 96.4 | 94.4 | 88.7 | 100.0 | 90.3 |
| ICH | 96.0 | 96.7 | 92.6 | 89.6 | 84.6 | 97.3 | .. | na | 92.8 |
Turnaround time
Average turnaround times for vacant stock, 2015-16 (days)
| NSW | Vic | Qld | WA | SA | Tas | ACT | NT | Aust | |
|---|---|---|---|---|---|---|---|---|---|
| PH | 35.3 | 28.6 | 30.5 | 23.3 | na | 24.7 | 29.7 | 72.2 | na |
| SOMIH | 44.4 | .. | 41.9 | .. | na | 33.0 | .. | .. | na |
Notes
These data and caveats for these data are available in chapter 18 and attachment 18A.
Some percentages reported in these tables include 95 per cent confidence intervals (for example, 80 per cent ± 2.7 per cent).
na Not available. .. Not applicable. – Nil or rounded to zero. np Not published.
Performance indicator data for Aboriginal and Torres Strait Islander people in this chapter are available in the attachment tables listed below. Contextual data and further supporting information can be found in the chapter.
| Table number | Table title |
|---|---|
| Table 18A.10 | Greatest need allocations as a proportion of all new allocations — SOMIH (per cent) |
| Table 18A.13 | Proportion of new tenancies allocated to households with special needs — SOMIH (per cent) |
| Table 18A.16 | Proportion of low income households in social housing experiencing rental stress (spending more than 30 per cent of gross household income on rent), at 30 June (per cent) |
| Table 18A.19 | Proportion of household gross income spent on rent — low income households in SOMIH, at 30 June (per cent) |
| Table 18A.24 | Proportion of overcrowded households at 30 June — SOMIH |
| Table 18A.26 | Proportion of overcrowded households in Indigenous community housing (per cent) |
| Table 18A.27 | Proportion of Aboriginal and Torres Strait Islander households in public housing living in overcrowded conditions, by remoteness (per cent) |
| Table 18A.28 | Proportion of Aboriginal and Torres Strait Islander households in SOMIH living in overcrowded conditions, by remoteness (per cent) |
| Table 18A.29 | Underutilisation in social housing at 30 June (per cent) |
| Table 18A.32 | Proportion of SOMIH tenants rating amenity aspects as important and meeting their needs, 2016 (per cent) |
| Table 18A.33 | Proportion of SOMIH tenants rating location aspects as important and meeting their needs, 2016 (per cent) |
| Table 18A.37 | Dwelling condition, SOMIH, 2016 (per cent) |
| Table 18A.39 | Dwelling condition, Indigenous community housing (per cent) |
| Table 18A.41 | Customer satisfaction — SOMIH, 2016 (per cent) |
| Table 18A.45 | Net recurrent cost of providing assistance per dwelling (excluding the cost of capital) — SOMIH ($ per dwelling) |
| Table 18A.47 | Net recurrent cost per dwelling — Indigenous community housing (2014-15 dollars) |
| Table 18A.49 | SOMIH rent collection rate (per cent) |
| Table 18A.51 | Indigenous community housing rent collection rate (per cent) |
| Table 18A.53 | SOMIH occupancy rates as at 30 June (per cent) |
| Table 18A.55 | Indigenous community housing occupancy rates at 30 June (per cent) |
| Table 18A.57 | Average turnaround times for vacant stock — SOMIH (days) |