Report on Government Services 2019
Part E, Chapter 12
12 Public hospitals
This chapter reports on the performance of governments in providing public hospitals, with a focus on acute care services.
Download the chapter
- Chapter 12 Public hospitals and attachment tables (PDF - 3368 Kb)
- Chapter 12 Public hospitals (Word - 182 Kb)
- Chapter 12 Attachment tables (XLSX - 955 Kb)
- Key Facts
- Indicator Framework
- Indicator Results
- Indigenous Data
Expenditure on public hospitals (excluding depreciation) was around $63.8 billion in 2016-17, with the Australian, State and Territory governments funding 91.6 per cent (non-government sources funded the remaining 8.4 per cent).
Nationally, in 2016-17, government expenditure on public hospitals was equivalent to $2606 per person, similar to 2015-16 ($2603) in real terms.
In 2016-17, there were 695 public hospitals in Australia – 3 fewer than 2015-16. Although 68.1 per cent of hospitals had 50 or fewer beds, these smaller hospitals represented only 13.4 per cent of total available beds.
There were approximately 6.6 million separations from public (non-psychiatric) hospitals in 2016-17. Nationally, this is equivalent to 254.2 separations per 1000 people. Acute care separations accounted for the majority of separations from public hospitals.
A total of 35.5 million individual service events were provided to non-admitted patients in public hospitals in 2016-17.
There were 7.8 million presentations to emergency departments in 2016-17.
Public hospitals aim to alleviate or manage illness and the effects of injury by providing acute, non and sub-acute care along with emergency and outpatient care that is:
- timely and accessible to all
- appropriate and responsive to the needs of individuals throughout their lifespan and communities
- high quality and safe
- well co-ordinated to ensure continuity of care where more than one service type, and/or ongoing service provision is required
- sustainable.
Governments aim for public hospital services to meet these objectives in an equitable and efficient manner.
The performance indicator framework provides information on equity, efficiency and effectiveness, and distinguishes the outputs and outcomes of public hospitals. The performance indicator framework shows which data are complete and comparable in the 2019 Report.
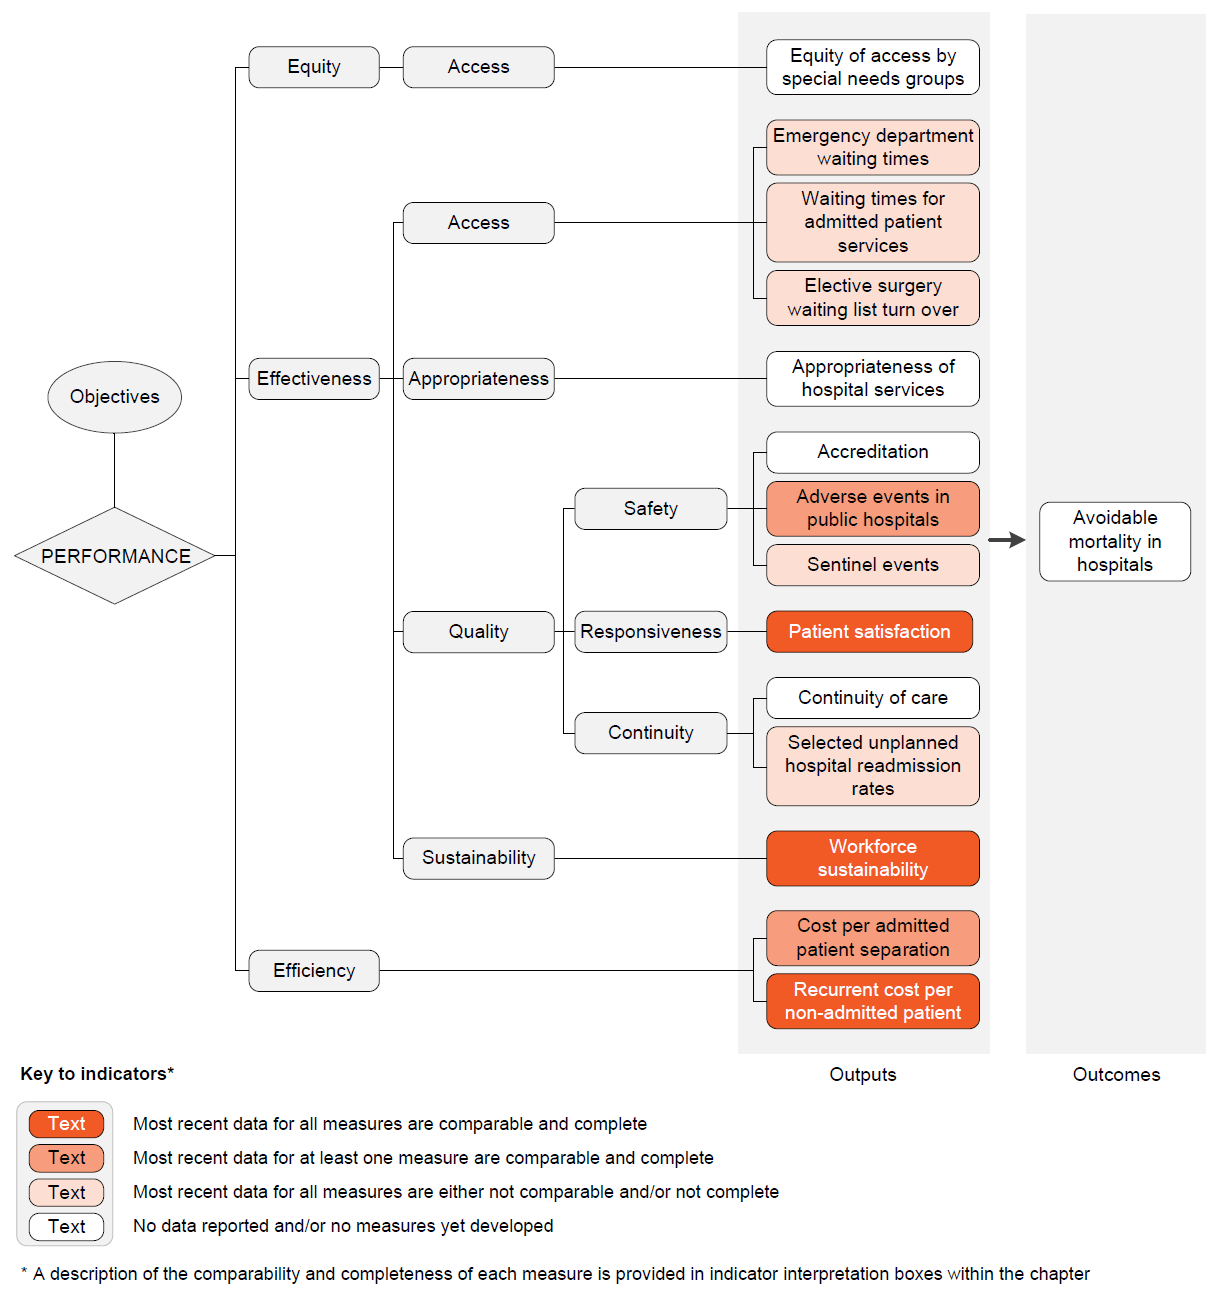
An overview of the Public hospitals performance indicator results are presented. Information to assist the interpretation of these data can be found in the indicator interpretation boxes in the Public hospitals chapter and attachment tables.
Effectiveness — Access indicators
Emergency department waiting times
Emergency department waiting times by triage category — proportion of patients seen on time, 2017-18 (per cent)
| Triage category | NSW | Vic | Qld | WA | SA | Tas | ACT | NT | Aust |
|---|---|---|---|---|---|---|---|---|---|
| Resuscitation | 100 | 100 | 100 | 100 | 100 | 100 | 100 | 100 | 100 |
| Emergency | 81 | 76 | 72 | 81 | 63 | 71 | 77 | 63 | 76 |
| Urgent | 76 | 68 | 59 | 50 | 48 | 56 | 37 | 49 | 64 |
| Semi-urgent | 80 | 72 | 73 | 65 | 66 | 66 | 48 | 56 | 73 |
| Non-urgent | 94 | 89 | 93 | 92 | 89 | 89 | 81 | 87 | 92 |
| Total | 80 | 72 | 68 | 64 | 60 | 66 | 49 | 57 | 72 |
Length of stay for emergency department care, proportion of patients staying for four hours or less, 2017‑18
| NSW | Vic | Qld | WA | SA | Tas | ACT | NT | Aust | |
|---|---|---|---|---|---|---|---|---|---|
| % | 73.5 | 69.2 | 72.1 | 75.7 | 60.8 | 64.4 | 64.0 | 62.7 | 71.1 |
Waiting times for admitted patient services
Overall elective surgery waiting times, 2017-18 (days waited)
| NSW | Vic | Qld | WA | SA | Tas | ACT | NT | Aust | |
|---|---|---|---|---|---|---|---|---|---|
| 50th percentile | 55 | 29 | 40 | 39 | 42 | 42 | 54 | 23 | 40 |
| 90th percentile | 327 | 150 | 279 | 199 | 262 | 238 | 344 | 160 | 268 |
Elective surgery waiting times by clinical urgency category, 2017-18 (per cent)
Most recent data for this measure are not comparable but are complete, subject to caveats.
Data are available in tables 12A.24-31.
Presentations to emergency departments with a length of stay of 4 hours or less ending in admission, public hospitals, 2017-18 (per cent)
| Triage category | NSW | Vic | Qld | WA | SA | Tas | ACT | NT | Aust |
|---|---|---|---|---|---|---|---|---|---|
| Resuscitation | 49 | 57 | 55 | 68 | 56 | 50 | 61 | 45 | 55 |
| Emergency | 43 | 53 | 56 | 60 | 45 | 33 | 50 | 32 | 50 |
| Urgent | 41 | 51 | 54 | 50 | 36 | 25 | 36 | 30 | 46 |
| Semi-urgent | 46 | 55 | 57 | 53 | 44 | 28 | 40 | 31 | 50 |
| Non-urgent | 66 | 67 | 68 | 60 | 60 | 43 | 46 | 44 | 64 |
| Total | 43 | 53 | 55 | 54 | 41 | 28 | 40 | 31 | 49 |
Elective surgery waiting list turn over
The number of people removed from elective surgery waiting lists, divided by the number of people added to public hospital elective surgery waiting lists, multiplied by 100, 2016-17
| NSW | Vic | Qld | WA | SA | Tas | ACT | NT | Aust | |
|---|---|---|---|---|---|---|---|---|---|
| Additions (no.) | 251 641 | 222 271 | 176 812 | 101 428 | 67 550 | 21 180 | 15 571 | 9 910 | 866 363 |
| Removals (no.) | 222 893 | 196 086 | 143 447 | 86 747 | 58 655 | 19 187 | 12 826 | 8 250 | 748 091 |
| Turn over (%) | 88.6 | 88.2 | 81.1 | 85.5 | 86.8 | 90.6 | 82.4 | 83.2 | 86.3 |
Effectiveness — Quality — Safety indicators
Adverse events in public hospitals
Selected healthcare-associated infections in acute care hospitals, 2017-18 (per 10 000 patient days)
| NSW | Vic | Qld | WA | SA | Tas | ACT | NT | Aust | |
|---|---|---|---|---|---|---|---|---|---|
| Rate | 0.7 | 0.8 | 0.6 | 0.8 | 0.8 | 0.9 | 0.8 | 0.4 | 0.7 |
Adverse events treated in hospitals, 2016-17 (per 100 separations)
| NSW | Vic | Qld | WA | SA | Tas | ACT | NT | Aust | |
|---|---|---|---|---|---|---|---|---|---|
| Rate | 7.0 | 6.1 | 6.5 | 7.3 | 7.6 | 8.3 | 7.0 | 3.6 | 6.6 |
Falls resulting in patient harm in public hospitals, 2016-17 (per 1000 separations)
| NSW | Vic | Qld | WA | SA | Tas | ACT | NT | Aust | |
|---|---|---|---|---|---|---|---|---|---|
| Rate | 6.2 | 3.8 | 4.2 | 5.4 | 5.9 | 7.6 | 4.5 | 1.7 | 4.9 |
Sentinel events
Adverse events occurring due to hospital system and process deficiencies that result in death of, or serious harm to, a patient, 2016-17
Most recent data for this measure are not comparable but are complete, subject to caveats .
Data are available in tables 12A.38–46.
Effectiveness — Quality — Responsiveness indicators
Patient satisfaction
Proportion (per cent) of persons who went to an emergency department in the last 12 months reporting that in 2017-18:
| NSW | Vic | Qld | WA | SA | Tas | ACT | NT | Aust | |
|---|---|---|---|---|---|---|---|---|---|
| ED doctors, specialists or nurses always or often listened carefully to them | |||||||||
| Doctors/ specialists | 84.7 | 86.1 | 89.4 | 86.4 | 85.9 | 86.6 | 81.1 | 84.6 | 86.3 |
| Nurses | 88.5 | 92.2 | 91.9 | 89.4 | 90.6 | 92.0 | 89.5 | 92.1 | 90.4 |
| ED doctors, specialists or nurses always or often showed respect to them | |||||||||
| Doctors/ specialists | 87.4 | 87.9 | 90.3 | 87.8 | 89.4 | 88.7 | 88.3 | 85.8 | 88.6 |
| Nurses | 88.7 | 91.8 | 93.6 | 90.5 | 91.8 | 92.3 | 92.6 | 92.1 | 91.0 |
| ED doctors, specialists or nurses always or often spent enough time with them | |||||||||
| Doctors/ specialists | 82.5 | 83.2 | 86.1 | 80.5 | 84.1 | 82.8 | 77.5 | 78.5 | 83.5 |
| Nurses | 86.8 | 87.7 | 88.8 | 88.4 | 87.6 | 89.7 | 88.4 | 93.0 | 87.8 |
| NSW | Vic | Qld | WA | SA | Tas | ACT | NT | Aust | |
|---|---|---|---|---|---|---|---|---|---|
| Hospital doctors, specialists or nurses always or often listened carefully to them | |||||||||
| Doctors/ specialists | 90.7 | 92.2 | 91.8 | 90.0 | 91.3 | 90.3 | 90.5 | 86.5 | 91.2 |
| Nurses | 91.4 | 91.6 | 91.6 | 91.7 | 93.1 | 94.5 | 89.9 | 94.1 | 92.1 |
| Hospital doctors, specialists or nurses always or often showed respect to them | |||||||||
| Doctors/ specialists | 93.0 | 92.5 | 91.7 | 92.0 | 93.2 | 90.2 | 89.4 | 86.5 | 92.5 |
| Nurses | 92.7 | 93.2 | 92.8 | 91.7 | 96.1 | 94.1 | 94.5 | 93.5 | 92.9 |
| Hospital doctors, specialists or nurses always or often spent enough time with them | |||||||||
| Doctors/ specialists | 88.2 | 87.8 | 88.4 | 85.7 | 91.5 | 86.8 | 77.1 | 84.3 | 88.0 |
| Nurses | 89.5 | 89.4 | 90.0 | 90.6 | 90.4 | 92.3 | 85.5 | 95.1 | 90.1 |
Effectiveness — Quality — Continuity indicators
Selected unplanned hospital readmission rates
Rate at which patients unexpectedly return to hospital within 28 days for further treatment of the same condition, 2016-17 (per 1000 separations)
| Surgical procedure prior to separation | NSW | Vic | Qld | WA | SA | Tas | ACT | NT | Aust |
|---|---|---|---|---|---|---|---|---|---|
| Knee replacement | 20.5 | 19.4 | 32.6 | 19.6 | 24.3 | 44.9 | 3.6 | 45.5 | 23.2 |
| Hip replacement | 16.1 | 16.9 | 27.3 | 16.8 | 13.6 | 39.9 | 4.0 | 33.3 | 18.6 |
| Tonsillectomy and adenoidectomy | 35.8 | 28.1 | 58.9 | 57.2 | 42.7 | 56.6 | 31.7 | 104.7 | 39.8 |
| Hysterectomy | 27.9 | 29.1 | 45.7 | 30.8 | 27.5 | 46.0 | 25.4 | 57.1 | 33.1 |
| Prostatectomy | 24.8 | 17.0 | 31.6 | 23.9 | 14.0 | 11.2 | 30.0 | 93.8 | 22.5 |
| Cataract surgery | 2.7 | 2.4 | 5.7 | 1.7 | 3.7 | 4.3 | 2.9 | 5.1 | 3.1 |
| Appendicectomy | 24.4 | 19.6 | 23.5 | 27.9 | 24.0 | 29.9 | 23.3 | 50.4 | 23.3 |
Effectiveness — Sustainability indicators
Workforce sustainability
Nursing workforce by age group, 2017 (per cent)
| NSW | Vic | Qld | WA | SA | Tas | ACT | NT | Aust | |
|---|---|---|---|---|---|---|---|---|---|
| <30 years | 16.4 | 18.6 | 17.2 | 16.4 | 14.3 | 14.3 | 17.2 | 18.0 | 17.0 |
| 30–39 years | 22.8 | 23.8 | 22.2 | 23.2 | 21.5 | 18.1 | 27.1 | 27.4 | 22.9 |
| 40–49 years | 22.4 | 22.7 | 24.8 | 24.0 | 23.7 | 22.1 | 23.9 | 20.2 | 23.2 |
| 50–59 years | 24.3 | 23.1 | 24.7 | 24.6 | 27.9 | 31.1 | 21.3 | 22.7 | 24.5 |
| 60+ years | 14.0 | 11.8 | 11.1 | 11.8 | 12.5 | 14.4 | 10.4 | 11.7 | 12.4 |
Medical practitioner workforce by age group, 2017 (per cent)
| NSW | Vic | Qld | WA | SA | Tas | ACT | NT | Aust | |
|---|---|---|---|---|---|---|---|---|---|
| <30 years | 9.1 | 10.5 | 9.6 | 10.1 | 9.5 | 9.6 | 8.3 | 10.9 | 9.7 |
| 30–39 years | 26.2 | 28.5 | 28.6 | 30.0 | 27.2 | 23.2 | 27.7 | 37.0 | 27.8 |
| 40–49 years | 24.4 | 23.4 | 25.9 | 25.9 | 24.5 | 25.6 | 25.3 | 23.5 | 24.6 |
| 50–59 years | 20.4 | 20.2 | 20.8 | 19.5 | 21.0 | 23.0 | 22.5 | 16.4 | 20.4 |
| 60+ years | 20.0 | 17.4 | 15.1 | 14.6 | 17.8 | 18.6 | 16.2 | 12.2 | 17.4 |
Efficiency indicators
Cost per admitted patient separation
Recurrent cost per weighted separation, 2016-17
| NSW | Vic | Qld | WA | SA | Tas | ACT | NT | Aust | |
|---|---|---|---|---|---|---|---|---|---|
| $ | 4 870 | 4 613 | 4 941 | 6 280 | 5 420 | 5 138 | 5 598 | 6 321 | 5 020 |
Capital cost per weighted separation, 2016-17
| NSW | Vic | Qld | WA | SA | Tas | ACT | NT | Aust | |
|---|---|---|---|---|---|---|---|---|---|
| $ | 971 | 944 | 1 042 | 1 081 | 704 | 685 | 1 045 | 1 032 | 966 |
Recurrent cost per non-admitted patient
Average cost per non-admitted acute emergency department presentation, 2016-17
| NSW | Vic | Qld | WA | SA | Tas | ACT | NT | Aust | |
|---|---|---|---|---|---|---|---|---|---|
| $ | 538 | 429 | 507 | 619 | 526 | 469 | 540 | 557 | 515 |
Average cost per non-admitted service event, 2016-17
| NSW | Vic | Qld | WA | SA | Tas | ACT | NT | Aust | |
|---|---|---|---|---|---|---|---|---|---|
| $ | 216 | 341 | 324 | 350 | 401 | 297 | 281 | 496 | 297 |
Notes
These data and caveats for these data are available in chapter 12 and attachment 12A.
# Proportion has a margin of error >10 percentage points which should be considered when using this information.
– Nil or rounded to zero. np Not published.
Performance indicator data for Aboriginal and Torres Strait Islander people in this chapter are available in the attachment tables listed below. Contextual data and further supporting information can be found in the chapter.
| Table number | Table title |
|---|---|
| Table 12A.15 | Patients treated within national benchmarks for emergency department waiting time, by Indigenous status, by State and Territory |
| Table 12A.20 | Waiting times for elective surgery in public hospitals, by Indigenous status and procedure, by State and Territory (days) |
| Table 12A.37 | Separations for falls resulting in patient harm in hospitals, per 1000 separations, 2016-17 |
| Table 12A.52 | Unplanned hospital readmission rates, by Indigenous status, hospital peer group, remoteness and SEIFA IRSD quintiles, 2016-17 |