Report on Government Services 2019
Part E, Chapter 10
10 Primary and community health
This chapter reports on the performance of primary and community health services which include general practice, pharmaceutical services, dentistry, allied health services, community health services, maternal and child health and alcohol and other drug treatment.
Download the chapter
- Chapter 10 Primary and community health and attachment tables (PDF - 3460 Kb)
- Chapter 10 Primary and community health (Word - 231 Kb)
- Chapter 10 Attachment tables (XLSX - 1096 Kb)
Note: An errata was released with this part reflecting updates to the files above.
Errata
The following data have changed for Chapter 10 Primary and community health:
- Amended data for GP expenditure and GP expenditure per person for 2012-13 to 2017-18 for all jurisdictions and Australia. Affects attachment table 10A.2 and pages 10.4 and 10.30 (text and figure 10.11).
- Key Facts
- Indicator Framework
- Indicator Results
- Indigenous Data
Government recurrent expenditure on primary and community health was around $36.9 billion in 2016-17.
Australian Government expenditure on general practice in Australia was $9.5 billion, or $382.1 per person, in 2017‑18.
Australian Government expenditure on the PBS was around $8.5 billion, or $341 per person, in 2017-18.
Primary and community health services aim to promote health, prevent illness and to support people to manage their health issues in the community, by providing services that are:
- timely, affordable and accessible to all
- appropriate and responsive to meet the needs of individuals throughout their lifespan and communities
- high quality and safe
- well co-ordinated to ensure continuity of care where more than one service type, and/or ongoing service provision is required
- sustainable.
Governments aim for primary and community health services to meet these objectives in an equitable and efficient manner.
The performance indicator framework provides information on equity, efficiency and effectiveness, and distinguishes the outputs and outcomes of health services. The performance indicator framework shows which data are complete and comparable in the 2019 Report.
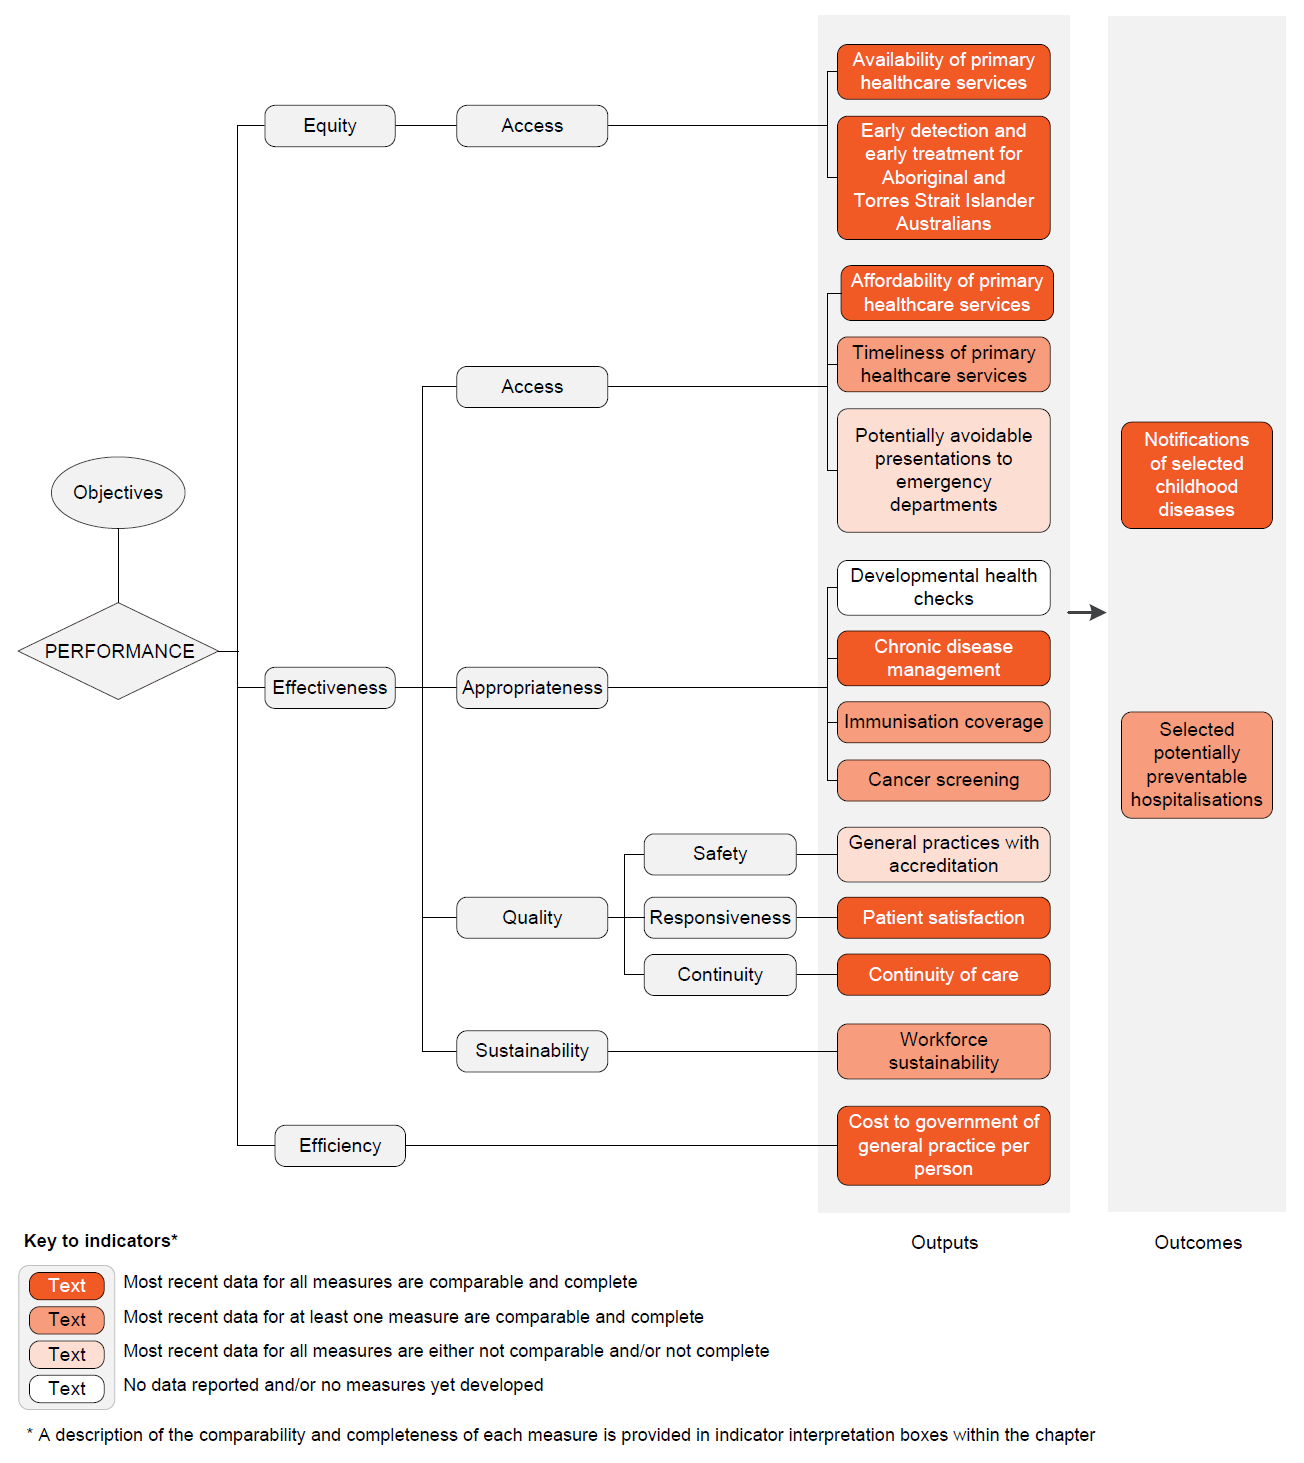
An overview of the Primary and community health performance indicator results are presented. Information to assist the interpretation of these data can be found in the indicator interpretation boxes in the Primary and community health chapter and attachment tables.
Equity — Access indicators
Availability of primary healthcare services
PBS medicines by region - number of people per approved PBS provider by region, 30 June 2018
| NSW | Vic | Qld | WA | SA | Tas | ACT | NT | Aust | |
|---|---|---|---|---|---|---|---|---|---|
| Urban no. | 4 026 | 4 454 | 4 212 | 4 103 | 3 822 | 3 428 | 5 086 | 4 780 | 4 167 |
| Rural no. | 3 559 | 3 695 | 3 010 | 2 610 | 2 890 | 2 940 | .. | 1 463 | 3 058 |
Availability of FSE GPs by region, 2017-18 (rate per 100 000 population)
| NSW | Vic | Qld | WA | SA | Tas | ACT | NT | Aust | |
|---|---|---|---|---|---|---|---|---|---|
| Major cities | 104.7 | 99.9 | 113.9 | 94.8 | 109.0 | .. | 77.1 | .. | 103.5 |
| Inner regional | 107.1 | 103.3 | 109.8 | 101.4 | 78.2 | 97.9 | np | .. | 104.2 |
| Outer regional, remote & very remote | np | np | 96.8 | 77.9 | 85.0 | 84.2 | .. | 54.9 | 89.9 |
Availability of FSE GPs by sex, 2017-18 (rate per 100 000 population)
| NSW | Vic | Qld | WA | SA | Tas | ACT | NT | Aust | |
|---|---|---|---|---|---|---|---|---|---|
| Females | 79.4 | 74.3 | 80.7 | 67.8 | 71.7 | 76.6 | 69.0 | 87.5 | 76.5 |
| Males | 127.0 | 124.0 | 138.7 | 118.1 | 138.0 | 113.2 | 83.6 | 93.8 | 127.0 |
Availability of public dentists by region, 2017 (rate per 100 000 population)
| NSW | Vic | Qld | WA | SA | Tas | ACT | NT | Aust | |
|---|---|---|---|---|---|---|---|---|---|
| Major cities | 5.2 | 5.3 | 6.5 | 6.0 | 6.7 | – | 5.5 | – | 5.6 |
| Inner regional | 5.6 | 4.6 | 6.8 | 7.1 | 4.1 | 7.5 | – | – | 5.8 |
| Outer regional | 1.3 | 4.6 | 8.6 | 5.9 | 5.0 | 2.7 | – | 9.5 | 5.6 |
| Remote/very remote | np | np | 15.2 | 6.8 | np | – | – | 10.2 | 9.0 |
Early detection and early treatment for Aboriginal and Torres Strait Islander Australians
Older Aboriginal and Torres Strait Islander Australians who received a health assessment, 2017-18
| NSW | Vic | Qld | WA | SA | Tas | ACT | NT | Aust | |
|---|---|---|---|---|---|---|---|---|---|
| % | 39.1 | 25.7 | 49.4 | 36.7 | 27.9 | 27.9 | 30.1 | 45.0 | 40.0 |
Effectiveness — Access indicators
Affordability of primary healthcare services
People deferring visits to GPs due to cost, 2017-18
| NSW | Vic | Qld | WA | SA | Tas | ACT | NT | Aust | |
|---|---|---|---|---|---|---|---|---|---|
| % | 2.8 ± 0.5 | 4.4 ± 0.8 | 4.5 ± 0.6 | 4.2 ± 0.9 | 3.5 ± 0.9 | 8.7 ± 1.8 | 8.0 ± 1.8 | 2.9 ± 1.2# | 4.0 ± 0.3 |
People deferring buying prescribed medicines due to cost, 2017-18
| NSW | Vic | Qld | WA | SA | Tas | ACT | NT | Aust | |
|---|---|---|---|---|---|---|---|---|---|
| % | 7.2 ± 0.8 | 6.4 ± 1.0 | 7.2 ± 1.0 | 7.7 ± 1.1 | 6.3 ± 1.0 | 8.2 ± 1.8 | 7.1 ± 2.2 | 6.0 ± 2.2 | 7.0 ± 0.5 |
Timelessness of primary healthcare services
Median time waited for public dental care, 2017-18
Most recent data for this measure are not comparable or complete.
Data are available in attachment tables 10A.31–38.
GP waiting times for urgent appointment 2017-18 — less than 4 hours
| NSW | Vic | Qld | WA | SA | Tas | ACT | NT | Aust | |
|---|---|---|---|---|---|---|---|---|---|
| % | 63.4 ± 3.1 | 65.9 ± 3.1 | 62.6 ± 1.8 | 63.5 ± 4.6 | 63.3 ± 8.4 | 52.6 ± 7.0 | 39.4 ± 10.7# | 58.2 ± 10.6# | 63.3 ± 1.5 |
Potentially avoidable presentations to emergency departments
Selected potentially avoidable presentations to emergency departments, 2017-18
| NSW | Vic | Qld | WA | SA | Tas | ACT | NT | Aust | |
|---|---|---|---|---|---|---|---|---|---|
| no. | 1 150 276 | 629 406 | 406 783 | 332 889 | 159 689 | 61 590 | 53 041 | 56 339 | 2 850 013 |
Effectiveness — Appropriateness
Chronic disease management
Proportion of people aged 18 to 69 years with known diabetes who have a HbA1c (glycated haemoglobin) level less than or equal to 7.0 per cent, by sex, 2011-12
| NSW | Vic | Qld | WA | SA | Tas | ACT | NT | Aust | |
|---|---|---|---|---|---|---|---|---|---|
| % | 56.7 ± 14.9 | 35.5 ± 32.4 | 46.4 ± 13.9 | 61.3 ± 20.1 | 52.1 ± 29.1 | 69.9 ± 15.7 | 44.3 ± 26.9 | 47.7 ± 29.3 | 50.5 ± 8.7 |
Proportion of people with asthma with a written asthma action plan, 2014-15
| NSW | Vic | Qld | WA | SA | Tas | ACT | NT | Aust | |
|---|---|---|---|---|---|---|---|---|---|
| % | 32.8 ± 5.1 | 26.9 ± 4.7 | 26.0 ± 5.5 | 23.2 ± 7.0 | 35.8 ± 7.1 | 22.4 ± 5.4 | 32.8 ± 7.0 | 34.0 ± 13.8 | 28.4 ± 2.3 |
Immunisation coverage
Children aged 60 to 63 months who were fully immunised, 2017-18
| NSW | Vic | Qld | WA | SA | Tas | ACT | NT | Aust | |
|---|---|---|---|---|---|---|---|---|---|
| % | 94.4 | 95.3 | 94.3 | 92.8 | 94.2 | 95.7 | 94.9 | 93.1 | 94.4 |
Cancer screening
Participation rates for women in breast cancer screening, 1 January 2016 to 31 December 2017
| NSW | Vic | Qld | WA | SA | Tas | ACT | NT | Aust | |
|---|---|---|---|---|---|---|---|---|---|
| % | 53.2 | 53.8 | 55.1 | 55.8 | 59.1 | 58.4 | 57.1 | 37.8 | 54.5 |
Participation rates for women in cervical screening, 1 January 2016 to 31 December 2017 (ASR)
Most recent data for this measure were incomplete.
No national cervical screening data were available for the period 1 January 2016 to 31 December 2017. Historical data are available in attachment table 10A.48.
Participation rates for persons in bowel cancer screening, 1 January 2016 to 31 December 2017
| NSW | Vic | Qld | WA | SA | Tas | ACT | NT | Aust | |
|---|---|---|---|---|---|---|---|---|---|
| % | 38.2 | 43.2 | 40.8 | 43.0 | 46.4 | 46.4 | 43.4 | 28.1 | 41.3 |
Effectiveness — Quality — Safety
General practices with accreditation
Proportion of general practices with accreditation, 2018
Most recent data for this measure were incomplete.
No national accreditation data were available for 2018. Historical data are available in attachment table 10A.50.
Effectiveness — Quality — Responsiveness
Patient satisfaction
Proportion of people who saw a GP in the previous 12 months where the practitioner always or often listened carefully to them, 2017-18
| NSW | Vic | Qld | WA | SA | Tas | ACT | NT | Aust | |
|---|---|---|---|---|---|---|---|---|---|
| % | 91.9 ± 1.1 | 92.1 ± 1.3 | 91.4 ± 0.7 | 91.8 ± 1.4 | 92.4 ± 0.7 | 90.6 ± 1.8 | 92.7 ± 2.0 | 85.0 ± 2.8 | 91.8 ± 0.5 |
Proportion of people who saw a dental practitioner in the previous 12 months where the practitioner always or often listened carefully to them, 2017-18
| NSW | Vic | Qld | WA | SA | Tas | ACT | NT | Aust | |
|---|---|---|---|---|---|---|---|---|---|
| % | 95.7 ± – | 96.3 ± 1.3 | 96.4 ± 1.1 | 96.3 ± 1.9 | 95.7 ± – | 95.1 ± 2.6 | 97.3 ± 1.3 | 95.3 ± 13.8 | 96.0 ± – |
Effectiveness — Quality — Continuity
Continuity of care
Proportion of GP management plans and team care assessment plans that have been reviewed in the past 12 months, 2017-18
| NSW | Vic | Qld | WA | SA | Tas | ACT | NT | Aust | |
|---|---|---|---|---|---|---|---|---|---|
| % | 73.0 | 64.9 | 76.4 | 77.8 | 77.5 | 71.5 | 68.3 | 63.3 | 72.3 |
Effectiveness — Sustainability
Workforce sustainability
Proportion of FSE GPs in ten year age brackets, 2016-17
| NSW | Vic | Qld | WA | SA | Tas | ACT | NT | Aust | |
|---|---|---|---|---|---|---|---|---|---|
| <35 % | 8.5 | 9.2 | 9.9 | 11.1 | 9.0 | 10.9 | 6.0 | 14.5 | 9.3 |
| 35-44 % | 22.9 | 24.2 | 26.6 | 26.9 | 23.7 | 18.8 | 27.8 | 35.5 | 24.5 |
| 45-54 % | 27.1 | 28.2 | 29.0 | 28.3 | 31.1 | 29.2 | 30.8 | 24.5 | 28.2 |
| 55-64 % | 27.0 | 26.3 | 24.3 | 22.6 | 23.0 | 29.9 | 35.4 | 25.5 | 25.5 |
| 65-74 % | 12.2 | 10.6 | 10.2 | 11.1 | 13.2 | 11.3 | np | np | 10.6 |
| 75+ % | 2.3 | 1.6 | np | np | np | np | np | np | 1.7 |
Efficiency indicators
Data in this table have changed since an earlier version of the Report.
Cost of government of general practice per person
Expenditure per person on general practice, 2017-18
| NSW | Vic | Qld | WA | SA | Tas | ACT | NT | Aust | |
|---|---|---|---|---|---|---|---|---|---|
| $ | 389.8 | 369.0 | 410.3 | 344.2 | 395.2 | 385.0 | 288.0 | 368.4 | 382.1 |
Outcome indicators
Notifications of selected childhood diseases
Notifications of measles per 100 000 children aged 0–14 years, 2017-18
| NSW | Vic | Qld | WA | SA | Tas | ACT | NT | Aust | |
|---|---|---|---|---|---|---|---|---|---|
| Rate | 0.3 | 0.4 | 0.3 | 1.0 | – | – | – | – | 0.4 |
Selected potentially preventable hospitalisations
Separations for selected potentially preventable hospitalisations, 2016-17 (per 1000 people)
| NSW | Vic | Qld | WA | SA | Tas | ACT | NT | Aust | |
|---|---|---|---|---|---|---|---|---|---|
| Rate | 24.9 | 26.2 | 32.3 | 26.0 | 27.4 | 23.1 | 23.1 | 57.9 | 27.3 |
Notes
These data and caveats for these data are available in chapter 10 and attachment 10A.
Some percentages reported in these tables include 95 per cent confidence intervals.
# Proportion has a margin of error of greater than 10 percentage points which should be considered when using this information.
.. Not applicable. – Nil or rounded to zero. np Not published.
Performance indicator data for Aboriginal and Torres Strait Islander people in this chapter are available in the attachment tables listed below. Contextual data and further supporting information can be found in the chapter.
| Table number | Table title |
|---|---|
| Table 10A.17 | Approved providers of PBS medicines by PhARIA area at 30 June 2018 |
| Table 10A.18 | Approved providers of PBS medicines by geolocation, at 30 June |
| Table 10A.24 | Annual health assessments for older people by Indigenous status (per cent) |
| Table 10A.25 | Aboriginal and Torres Strait Islander people who received a health check or assessment, by age (per cent) |
| Table 10A.31 | Median waiting time for public dental care, NSW (days) |
| Table 10A.32 | Median waiting time for public dental care, Victoria (days) |
| Table 10A.33 | Median waiting time for public dental care, Queensland (days) |
| Table 10A.34 | Median waiting time for public dental care, WA (days) |
| Table 10A.35 | Median waiting time for public dental care, SA (days) |
| Table 10A.36 | Median waiting time for public dental care, Tasmania (days) |
| Table 10A.37 | Median waiting time for public dental care, ACT (days) |
| Table 10A.38 | Median waiting time for public dental care, NT (days) |
| Table 10A.47 | Participation rates for Aboriginal and Torres Strait Islander women screened by BreastScreen Australia (24 month period) (first and subsequent rounds) (per cent) |
| Table 10A.59 | Separations for selected potentially preventable hospitalisations by Indigenous status (per 1000 people) |
| Table 10A.61 | Separations for selected potentially preventable hospitalisations by Indigenous status and remoteness, Australia (per 1000 people) |
| Table 10A.62 | Separations for selected vaccine preventable conditions by Indigenous status, 2016-17 (per 1000 people) |
| Table 10A.63 | Separations for selected acute conditions by Indigenous status, 2016-17 (per 1000 people) |
| Table 10A.64 | Separations for selected chronic conditions by Indigenous status, 2016-17 (per 1000 people) |
| Table 10A.65 | Ratio of separations for Aboriginal and Torres Strait Islander people to all Australians, diabetes, 2016-17 |