Report on Government Services 2023
PART F, SECTION 15: RELEASED ON 24 JANUARY 2023
15 Services for people with disability
This section reports on the Australian, State and Territory governments’ assistance provided to people with disability and their carers. Performance reporting currently focuses on assistance provided by governments to people with disability via the National Disability Insurance Scheme (NDIS) and through specialist disability services under the National Disability Agreement (NDA), as well as the broad social and economic outcomes of people with disability and their use of mainstream services.
The Indicator results tab uses data from the data tables to provide information on the performance for each indicator in the Indicator framework. The same data are also available in CSV format.
Data downloads
- 15 Services for people with disability data tables (XLSX - 960 Kb)
- 15 Services for people with disability (CSV - 2556 Kb)
See the corresponding table number in the data tables for detailed definitions, caveats, footnotes and data source(s).
- Context
- Indicator framework
- Indicator results
- Indigenous data
- Explanatory material
Objectives for services for people with disability
Disability services aim to support people with disability and their carers to have an enhanced quality of life, enjoy choice and wellbeing, achieve independence, social and economic participation, and full inclusion in the community.
Under the NDIS, governments aim to achieve this objective through the provision of an NDIS that:
- enables people with disability to exercise choice and control in the pursuit of their goals and the planning and delivery of their supports
- provides reasonable and necessary supports including early intervention supports
- promotes the provision of high quality and innovative supports
- provides timely decisions on access to NDIS applicants.
For specialist disability services provided outside the NDIS, governments aim to achieve this objective by providing access to disability services:
- that meet the individual needs of people with disability and their carers
- that provide skills and support to people with disability to enable them to live as independently as possible
- that meet a particular standard of quality
- on the basis of relative need
- that assist families and carers in their caring role.
Governments aim to meet these objectives in an equitable and efficient manner.
Service overview
Governments provide assistance to people with disability and their carers through the NDIS and specialist disability services.
The NDIS was established under the National Disability Insurance Scheme Act 2013 (Cth). The NDIS adopts an insurance-based model of funding and delivering supports for people with disability. The scheme is not means tested and is uncapped (demand-driven). The NDIS provides reasonable and necessary supports to people with a permanent and significant disability who need assistance with everyday activities.
People applying to access the scheme are assessed according to a standard set of criteria. People who meet these criteria receive a package of funding to purchase the supports identified in their approved plan. The NDIS market-based approach is based on the premise that people with disability should be able to exercise choice and control in the supports they access.
Services and supports provided to NDIS participants are regulated by the NDIS Quality and Safeguards Commission. The Commission's role includes provider registration, complaints management and reportable incidents, behaviour support, and compliance with practice standards and the NDIS code of conduct. During 2021-22, the Commission received 4521 complaints and was notified of 1 439 485 reportable incidents by NDIS providers (tables 15A.48-50). The NDIA also receives complaints relating to the Scheme (NDIA 2022).
Complaints about state-funded specialist disability services operating outside the NDIS can be made to independent agencies across jurisdictions (for example, ombudsmen and disability services commissioners).
The NDA (effective 1 January 2009, revised in 2012 and with performance benchmarks that expired in 2018) provided a national framework for the delivery of disability services. However, with almost complete transition of state and territory services to the NDIS (WA will complete transition by mid-2023), the number and range of specialist disability services provided under the NDA has declined. Specialist disability services that continue to be provided include:
- employment services, which are delivered by the Australian Government
- Basic Community Care (BCC) services, which assist people with disability or a chronic health condition aged under 65 years (and Aboriginal and Torres Strait Islander people aged under 50 years) to live independently and to actively participate and engage in their community.
People with disability have the same right of access to mainstream services as all Australians, consistent with the goals of Australia’s Disability Strategy 2021 - 2031 (the Strategy), launched on 3 December 2021. The Strategy sets out Australia's national disability policy framework. Its purpose is to:
- provide national leadership towards greater inclusion of people with disability
- guide activity across all areas of public policy to be inclusive and responsive to people with disability
- drive mainstream services and systems to improve outcomes for people with disability
- engage, inform and involve the whole community in achieving a more inclusive society.
Governments will report annually on progress against seven Strategy outcome areas. All levels of government have committed to deliver more comprehensive and visible reporting under the Strategy through the Outcomes Framework.
Data on the participation of people with disability in mainstream government services can be found in other sections of this Report (sections 3, 4, 5, 14, 18, 19 and sector overview G).
Roles and responsibilities
The Australian, State and Territory governments have different but complementary roles and responsibilities:
- All governments share responsibility for NDIS policy, funding and governance (NDIA 2020).
- State and Territory governments are responsible for providing specialist disability services, except disability employment services.
- States and territories have full financial and operational responsibility for Basic Community Care (BCC) services for people with disability aged under 65 years (and Aboriginal and Torres Strait Islander people aged under 50 years).
- The Australian Government is responsible for providing employment services for people with disability and income support.
Funding
In 2021-22, governments contributed $29.2 billion to the NDIS, with a further $2.1 billion in government expenditure on specialist disability services provided outside of the NDIS (table 15A.1 and 15A.4). For all jurisdictions, contributions to the NDIS formed the bulk of funding for disability services (table 15A.5 and 15A.6). Further information on funding sources, categories of expenditure and government expenditure in prior years are available in data tables 15A.1 - 15A.6.
In 2021-22, the NDIS committed $36.1 billion in support to participants. This represents an increase of $3.0 billion (or 9.1 per cent) in committed supports to participants compared to the previous financial year (table 15A.18 and table 15.1).
At 30 June 2022, $26.9 billion of support committed to participants during the 2021-22 financial year had been paid.
Outlays on income support payments and allowances to people with disability and their carers in 2021-22 (on an accrual basis) amounted to $28.2 billion, comprising $18.3 billion for the Disability Support Pension, $6.6 billion for the Carer Payment, $2.5 billion for the Carer Allowance, $608.9 million for the Carer Supplement, $191.0 million for the Child Disability Assistance Payment, $34.5 million for the Mobility Allowance, $8.2 million for Essential Medical Equipment payments and $1.5 million for the Carer Adjustment Payment (DSS 2022).
Size and scope
The ABS estimates that 4.4 million Australians or 17.7 per cent of the population had a disability in 2018 (for those aged under 65 years, this was 2.4 million Australians or 11.6 per cent of this age group). An estimated 5.7 per cent of the population had a profound or severe core activity limitation (for those aged under 65 years this was 3.5 per cent) — these results are similar to 2015, 2012 and 2009 (ABS 2019, 2016, 2013, 2011a). Males and females are similarly affected by disability (for all ages, 17.6 per cent and 17.8 per cent, respectively; for those aged under 65 years, 12.0 per cent and 11.4 per cent, respectively) (ABS 2019).
Aboriginal and Torres Strait Islander people experience higher rates of disability than non-Indigenous people. In 2018, 8.8 per cent of all Aboriginal and Torres Strait Islander people living in private dwellings (excluding those living in very remote areas and discrete Aboriginal and Torres Strait Islander communities) had a profound or severe core activity limitation, similar to 2015 (7.3 per cent) — around 1.8 times the proportion for non-Indigenous people up from 1.5 times in 2015 (ABS 2018).
Table 15A.7 contains additional information on disability prevalence.
National Disability Insurance Scheme participants
Nationally, at 30 June 2022, there were 534 655 active NDIS participants with approved plans (table 15A.8), 38 846 of whom identified as Aboriginal or Torres Strait Islander (around 7.3 per cent of NDIS participants) (table 15A.10). Nationally, at 30 June 2022, 30 905 participants with approved plans had exited the Scheme since 1 July 2013 (NDIA 2022).
Nationally, at 30 June 2022, autism was the most common form of disability for NDIS participants (34.1 per cent), followed by intellectual disability (18.0 per cent) (table 15A.8). Data on the characteristics of NDIS participants are available in tables 15A.8-11.
Additional information on NDIS participants’ access to mainstream services and satisfaction with the NDIS is available in tables 15A.15-16. Information on the characteristics of active NDIS providers is available in table 15A.17. An analysis of the characteristics of NDIS participants linked to the Multi-Agency Data Integration Project is contained in Characteristics of National Disability Insurance Scheme participants, 2019: Analysis of linked data (ABS 2021).
Users of Commonwealth employment services
Nationally, in 2021-22, 179 720 people used Disability Management Services (table 15A.34) and 232 013 used Employment Support Services (table 15A.33).
Potential Population
An estimate of the population with the potential to require specialist disability services is referred to as the ‘NDA potential population’ — the number of people aged 0–64 years who require ongoing and/or long term episodic support, have a permanent or chronic impairment and substantially reduced capacity in one or more core activities (see Explanatory material tab for definitions). Note that this is distinct from the NDIS potential population, which is an estimate of the number of people with significant and enduring support needs who would be eligible for support under the NDIS. Table 15.2 shows the NDIS potential population and the NDA potential population.
Use of Basic Community Care
As service users have transitioned to the NDIS, only limited data are available on Basic Community Care (BCC). In 2021-22, for the three jurisdictions for which BCC service user data were available (Victoria, Queensland and Tasmania), there were a combined 67 418 service recipients (table 15A.12). For the twojurisdictions for which data on hours were available (Victoria and Tasmania), service recipients received around 1.3 million hours of service (table 15A.13). The majority of service hours were for nursing care and domestic assistance (23.0 per cent and 20.2 per cent respectively) (table 15A.13). The quality of BCC data varies across jurisdictions and comparisons should be made with caution.
Disability support workforce
The most recent State of the Disability Sector report (2022) provides information on the disability sector workforce. It reports that nationally at June 2022, 58 per cent of the workforce was permanent and 24 per cent of the workforce was employed full time (compared to around 60 per cent in the greater jobs market) (NDS 2022). An earlier 2018 disability workforce survey reported that the female to male workforce ratio is 7:3 and that workers over 45 years of age constitute roughly one third of the total workforce (NDS 2018).
Income support and allowances
At June 2022, there were around 765 000 recipients of the Disability Support Pension, 301 200 recipients of the Carer Payment, 632 100 recipients of the Carer Allowance, 655 500 recipients of the Carer Supplement (paid to Carer Payment and Carer Allowance recipients), 164 800 recipients of the Child Disability Assistance Payment and 11 500 recipients of the Mobility Allowance (table 15A.14).
Informal carers
Family and friends provide most of the help and care that people with disability receive. Information about informal carers enables governments to plan for future service demand for carer supports and assistance to the people for whom they care (see Explanatory material tab for different definitions of informal carers across collections).
In 2018, an estimated 861 600 informal primary carers (of which 628 400 were aged less than 65 years) provided the majority of assistance with self care, mobility and communication for people with disability (ABS 2019).
The performance indicator framework provides information on equity, effectiveness and efficiency, and distinguishes the outputs and outcomes of services for people with disability.
The performance indicator framework shows which data are complete and comparable in this Report. For data that are not considered directly comparable, text includes relevant caveats and supporting commentary. Section 1 discusses data comparability and completeness from a Report-wide perspective. In addition to the contextual information for this service area (see Context tab), the Report’s statistical context (section 2) contains data that may assist in interpreting the performance indicators presented in this section.
Improvements to performance reporting for services for people with disability are ongoing and include identifying data sources to fill gaps in reporting for performance indicators and measures, and improving the comparability and completeness of data.
Outputs
Outputs are the services delivered (while outcomes are the impact of these services on the status of an individual or group) (see section 1). Output information is also critical for equitable, efficient and effective management of government services.
Outcomes
Outcomes are the impact of services on the status of an individual or group (see section 1).
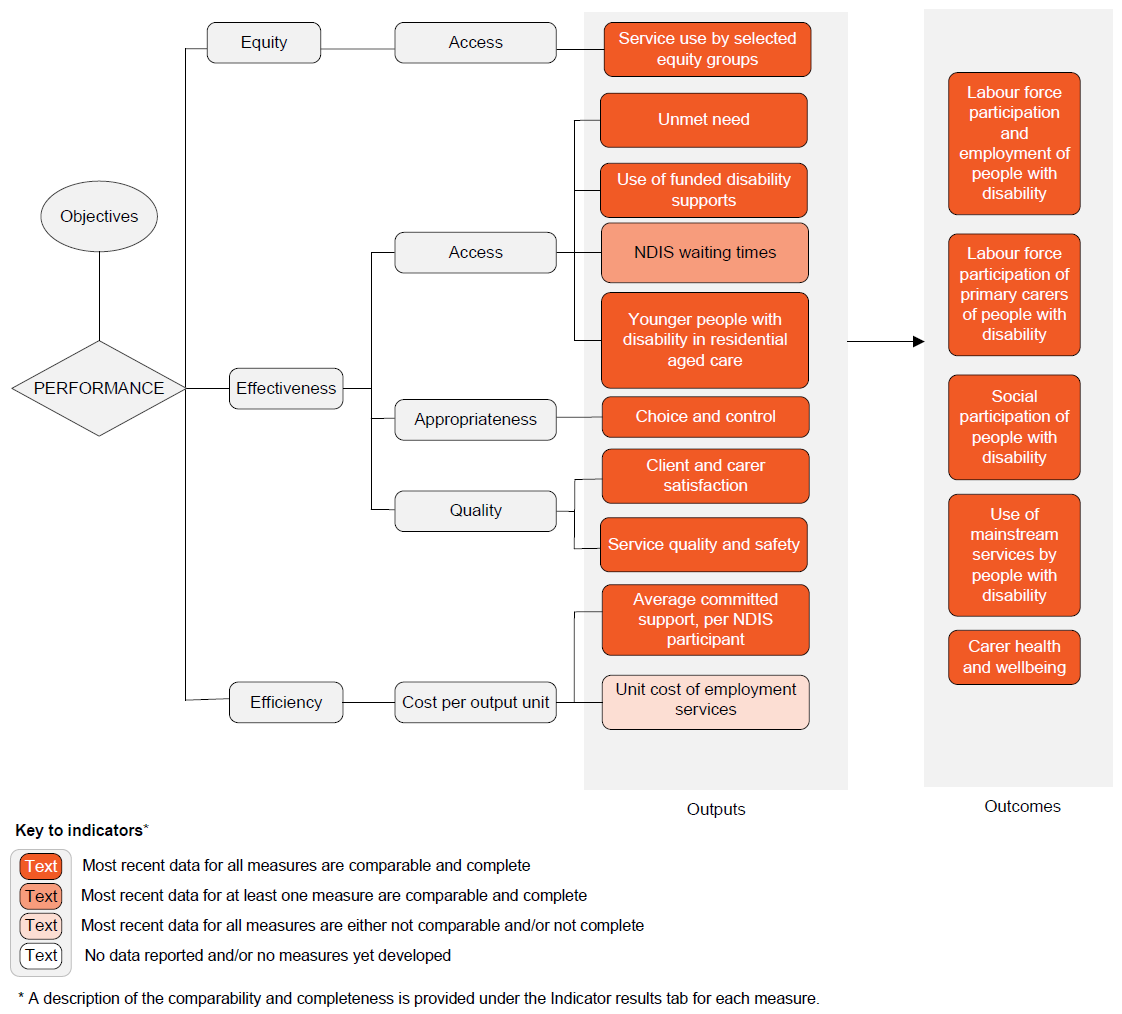
Text version of indicator framework
Performance — linked to Objectives
Outputs
- Equity — Access
- Service use by selected equity groups – most recent data for all measures are comparable and complete
- Effectiveness — Access
- Unmet need – most recent data for all measures are comparable and complete
- Use of funded disability supports – most recent data for all measures are comparable and complete
- NDIS waiting times – most recent data for at least one measure are comparable or complete
- Younger people with disability in residential aged care – most recent data for all measures are comparable and complete
- Effectiveness — Appropriateness
- Choice and control – most recent data for all measures are comparable and complete
- Effectiveness — Quality
- Client and carer satisfaction – most recent data for all measures are comparable and complete
- Service quality and safety – most recent data for all measures are comparable and complete
- Efficiency — Inputs per output unit
- Average committed supports, per NDIS participant – most recent data for all measures are comparable and complete
- Unit cost of employment services – most recent data for all measures are either not comparable and/or not complete
Outcomes
- Labour force participation and employment of people with disability – most recent data for all measures are comparable and complete
- Labour force participation of primary carers of people with disability – most recent data for all measures are comparable and complete
- Social participation of people with disability – most recent data for all measures are comparable and complete
- Use of mainstream services by people with disability – most recent data for all measures are comparable and complete
- Carer health and wellbeing – most recent data for all measures are comparable and complete
A description of the comparability and completeness is provided under the Indicator results tab for each measure.
This section presents an overview of 'Services for people with disability' performance indicator results. Different delivery contexts, locations and types of clients can affect the equity, effectiveness and efficiency of services for people with disability.
Information to assist interpretation of these data can be found with the indicators below and all data (footnotes and data sources) are available for download above as an excel spreadsheet and as a CSV dataset. Data tables are identified by a ‘15A’ prefix (for example, table 15A.1).
Specific data used in figures can be downloaded by clicking in the figure area, navigating to the bottom of the visualisation to the grey toolbar, clicking on the 'Download' icon and selecting 'Data' from the menu. Selecting 'PDF' or 'Powerpoint' from the 'Download' menu will download a static view of the performance indicator results.
1. Service use by selected equity groups
‘Service use by selected equity groups’ is an indicator of governments’ objective to provide disability services in an equitable manner.
‘Service use by selected equity groups’ is defined as the proportion of service users per 1000 people in the potential population in a selected equity group, compared with the proportion of service users per 1000 people in the potential population outside the selected equity group.
A service user is a person with disability who is an active NDIS participant (that is, has an approved NDIS plan) or a person with disability who received at least one funded specialist disability employment service.
The potential population estimates the number of people with the potential to require disability services at a point in time (typically as at 30 June). (Further details on potential populations can be found in the Explanatory material tab.)
Data are reported for three selected equity groups:
- People from outer regional and remote/very remote areas
- Aboriginal and Torres Strait Islander people
- People from culturally and linguistically diverse (CALD) backgrounds (defined as people born in a non‑English speaking country).
While a lower proportion within the selected equity group relative to outside the selected equity group can indicate reduced access, it can also represent strong alternative informal support networks (and consequently a lower level of otherwise unmet need) or a lower tendency for people in a selected equity group choosing to access disability services. Similarly, a higher proportion can suggest poor service targeting, a lack of alternative informal support networks, or a greater tendency of people in a selected equity group choosing to access disability services.
This indicator does not provide information on whether the services were appropriate for the needs of the people receiving them or correctly targeted on the basis of relative need. The indicator does not consider differences in the level of informal assistance available for people in selected equity groups and outside selected equity groups.
Nationally at 30 June 2022, the proportion of the potential population who were participants in the NDIS was:
- lower in remote and very remote areas than in major cities and inner and outer regional areas
- higher for Aboriginal and Torres Strait Islander people than non‑Indigenous people
- lower for people from a CALD background than people from a non‑CALD background (figure 15.1a).
Nationally in 2021‑22, the proportion of the potential population who used Commonwealth disability employment services was:
- lower in outer regional, remote and very remote areas than major cities and inner regional areas
- similar for Aboriginal and Torres Strait Islander people and non‑Indigenous people
- higher for people from a CALD background than people from a non-CALD background (figure 15.1b).
2. Unmet need
‘Unmet need’ is an indicator of governments’ objective to provide services that meet the individual needs of people with disability and their carers.
‘Unmet need’ is defined by two measures:
- the proportion of people (aged 0-64 years) living in households who need more formal assistance than they are currently receiving
- the proportion of carers (of people aged 0-64 years) who report a need for further assistance in their caring roles.
A low or decreasing proportion of people reporting a need for further assistance is desirable.
The ABS Survey of Disability, Ageing and Carers (SDAC) does not include people living in discrete Indigenous communities, which affects the representativeness of results for the NT. Approximately 20 per cent of the resident population of the NT live in discrete Indigenous communities.
Nationally in 2018, 37.5 per cent of people aged 0-64 years reported a need for more formal assistance than they are currently receiving (figure 15.2). The proportion was higher for females than males (39.0 per cent compared to 36.1 per cent) and higher for people in major cities compared to people in regional and remote areas (37.4 per cent compared to 36.8 per cent) (tables 15A.28-29).
Nationally in 2018, 32.0 per cent of carers of people aged 0-64 years reported a need for further assistance in their caring roles (figure 15.2). The proportion was higher for females than males (32.9 per cent compared to 30.1 per cent), and higher for people in major cities compared to people in regional and remote areas (33.4 per cent compared to 29.4 per cent) (tables 15A.30-31).
3. Use of funded disability supports
‘Use of funded disability supports’ is a proxy indicator of governments’ objective to provide access to disability services on the basis of relative need.
‘Use of funded disability supports’ is defined as the number of funded disability service users divided by the potential population for that service.
A service user is a person with disability who is an active NDIS participant (that is, has an approved NDIS plan) or who uses disability employment services. The potential population estimates the number of people with the potential to require funded disability supports at some time. (Further details on the potential populations can be found in the Explanatory material tab.)
For the NDIS, a high or increasing proportion of the potential population participating in the Scheme indicates greater access to the Scheme.
For disability employment services, a high or increasing proportion of the estimated potential population using a particular service indicates greater access to that service.
Nationally at 30 June 2022, the number of people with disability accessing the NDIS as a proportion of the potential population was 84.8 per cent — an increase of 68 036 participants from 30 June 2021 (figure 15.3a).
Nationally in 2021‑22, for people aged 15–64 years with disability and with an employment restriction:
- 12.9 per cent were using Australian Government funded Disability Management Services (DMS) — an increase from 8.4 per cent in 2012-13 (table 15A.34)
- 16.7 per cent were using Australian Government funded open employment services (Employment Support Services (ESS)) in 2021‑22 — an increase from 7.3 per cent in 2012-13 (figure 15.3b).
4. NDIS waiting times
‘NDIS waiting times’ is an indicator of governments’ objective to provide timely decisions on access by applicants to the NDIS.
‘NDIS waiting times’ measures the time taken (in days) for people to obtain access to the NDIS and is defined by two measures:
- ‘Timeliness of NDIS eligibility decision’ is defined as the time taken to determine a person’s eligibility for the NDIS, measured from the time a person submits an access request to the NDIS to the NDIA’s decision on the access request.
- ’Timeliness of first plan approval’ is defined as the time taken to complete approval of a participant’s first plan in the NDIS, measured from the time the NDIA approved a person’s access to the Scheme to the point of first plan approval by the Agency.
Short or decreasing times for making access decisions to the NDIS are desirable.
The scope of reporting on measure 1 'Timeliness of NDIS eligibility decision' is not comparable over time. In 2019, the scope changed to measure the average number of days to complete an access decision or request further information after an access request has been made.
Nationally in the June quarter 2022, it took an average of seven days for a decision to be made on access to the NDIS (a consistent trend over the past three years). For approvals of first plans, it took an average of 48 days, a decrease from 69 days in 2020 (figure 15.4).
5. Younger people with disability in residential aged care
‘Younger people with disability in residential aged care’ is an indicator of governments’ objective to provide access to disability services on the basis of relative need; and through the NDIS, to provide reasonable and necessary supports, including early intervention supports.
‘Younger people with disability in residential aged care’ is defined as the rate of non‑Indigenous people aged 0–64 years and Aboriginal and Torres Strait Islander people aged 0–49 years admitted to permanent residential aged care per 10 000 people in the potential population. (Further details on the potential population can be found in the Explanatory material tab.)
These data should be interpreted with care, as some younger people choose to remain in residential aged care for a variety of reasons, such as:
- their physical and nursing needs can be best met in residential aged care
- they are satisfied with their current living situation (that is, it is their preferred home)
- the facility is located close to family and friends, or they have family living in the same facility
- they are nearing the age of 65 and wish to remain.
Nationally in 2021‑22, the rate of people aged 0–64 years admitted to permanent residential aged care was 7.7 per 10 000 people in the potential population, a decrease from 2020-21 (12.3 per 10 000 people) and 2013-14 (36.7 per 10 000 people) (figure 15.5). Of those people aged 0–64 years admitted to permanent residential aged care in 2021-22, 96.0 per cent were aged 50 years or over (table 15A.37).
Data on the number of younger people receiving and separating from residential aged care to return to home/family are available in tables 15A.38–39. Nationally, at 30 June 2022, there were 2934 permanent aged care residents aged under 65 years. Of these, 94.2 per cent were aged 50 years or over (table 15A.38).
Data on the number of younger people receiving residential aged care by Indigenous status are available in table 15A.40. Data on State and Territory government expenditure for younger people with disability in residential aged care is reported in table 14A.3, of section 14 in this report.
Although data on the disability status of younger people entering, receiving, or exiting residential aged care are not available, table 15A.41 contains information on the subset of younger people in residential aged care who are NDIS participants.
6. Choice and control
‘Choice and control’ is an indicator of governments’ objective under the NDIS to enable people with disability to exercise choice and control in pursuing their goals and planning delivery of their supports.
‘Choice and control’ is defined as the proportion of NDIS participants who have been in the scheme for at least two years and who experience independence, choice and control over their care.
‘Choice and control’ is defined by two measures:
- the proportion of active NDIS participants (aged 15 years and over) who report that they get to choose who supports them
- the proportion of families and carers of active NDIS participants (aged 15 years and over) who report that they feel in control when selecting services.
Data for this indicator are sourced from the NDIS Outcome Framework longitudinal survey. NDIS participants are invited to complete this survey when their plans are reviewed, and only active participants as at 30 June are included. Active participants are eligible participants with an approved plan, but this might also include cases where a participant's plan has expired and a new plan has not formally commenced, but the participant has not exited the scheme.
High or increasing proportions of NDIS participants and families and carers of NDIS participants who report experiencing choice and control is desirable.
Nationally, at 30 June 2022, 50 per cent of NDIS participants aged 15 years and over reported that they get to choose who supports them, while 42 per cent of families and carers of NDIS participants aged 15 years and over reported that they feel in control when selecting services. Proportions varied across jurisdictions (table 15A.42).
7. Client and carer satisfaction
‘Client and carer satisfaction’ is an indicator of governments’ objective to provide access to disability services that meet a particular standard of quality; and under the NDIS, to promote the provision of high quality and innovative supports.
‘Client and carer satisfaction’ is defined by four measures:
- the proportion of people with disability aged 15–64 years who are satisfied with the quality of assistance received from organised and formal services in the last six months
- the proportion of people with disability aged 15–64 years who are satisfied with the range of organised and formal service options available
- the proportion of primary carers (of people with disability aged 0–64 years) who are satisfied with the quality of assistance received from formal services, by the person with disability and by the carer in the last six months
- the proportion of primary carers (of people with disability aged 0–64 years), who are satisfied with the range of formal service options available to help them in their caring role.
Care should be taken in interpreting results as the data are not able to distinguish between disability and mainstream services.
A high or increasing proportion of clients and carers who are satisfied is desirable as it suggests that the service received was of a higher quality.
Nationally in 2018, of people aged 15–64 years with a disability who received formal services in the previous six months, 76.6 per cent were satisfied with the quality of assistance they received (figure 15.7; table 15A.43), and 49.1 per cent were satisfied with the range of services received (table 15A.46). These figures were not significantly different from 2015 and 2012 (tables 15A.43 and 15A.46).
Nationally, the proportion of primary carers who were satisfied with the quality of services received was 66.6 per cent in 2018 compared to 73.4 per cent in 2015 and 69.0 per cent in 2012 (figure 15.7; table 15A.45). There was no significant change from 2015 in satisfaction with the range of services received (29.6 per cent in 2018, 32.5 per cent in 2015 and 33.7 per cent in 2012) (figure 15.5; table 15A.47).
8. Service quality and safety
'Service quality and safety' is an indicator of governments' objective to provide access to disability services that meet a particular standard of safety and quality; and, under the NDIS, to promote the provision of high-quality and innovative supports.
'Service quality and safety' refers to the right of individuals to receive safe and high-quality disability services, free from abuse and neglect and is defined by two measures:
- Complaints, as a proportion of active NDIS participants
- Reportable incidents, comprising:
- Unauthorised use of restrictive practices, as a proportion of active NDIS participants. Restrictive practices include seclusion and chemical, physical, mechanical and environmental restraint
- Other reportable incidents, as a proportion of active NDIS participants. Other reportable incidents include death, serious injury, abuse or neglect, unlawful sexual or physical contact, and sexual misconduct.
The NDIS Quality and Safeguards Commission receives complaints about NDIS providers and their workers. Complaints are classified into four categories: provider practice, provider policies and procedures; worker conduct or capability; and alleged abuse and neglect. When the NDIS Quality and Safeguards Commission receives a complaint, it can take a range of actions depending on the nature of the complaint, including holding conciliation meetings and undertaking investigations.
Registered providers must report specific 'reportable incidents' to the NDIS Quality and Safeguards Commission when connected with the provision of NDIS supports and services. Reportable incidents include death; serious injury; abuse or neglect; unlawful sexual or physical contact; sexual misconduct; and unauthorised use of restrictive practices.
The number of reportable incidents does not necessarily correlate with the number of instances of harm to a person with disability. Reports might include multiple notifications of the same matter, allegations of incidents, and situations where incidents occurred but injury was avoided.
High levels of service quality and safety are desirable, as evidenced by low and decreasing rates of complaints and reportable incidents. However, high or increasing rates might reflect more effective incident reporting mechanisms and organisational cultural change.
Nationally in 2021-22:
- there were 8.5 complaints per 1000 registered NDIS participants (table 15A.48)
- 16.6 NDIS participants were subject to unauthorised restrictive practices per 1000 NDIS participants (including seclusion and chemical, physical, mechanical and environmental restraint) (table 15A.50)
- there were 32.2 other reportable incidents (that is, excluding unauthorised use of restrictive practices) per 1000 NDIS participants. The rate per 1000 NDIS participants varied across category types from 0.9 for alleged sexual misconduct to 15.1 for alleged abuse and neglect (table 15A.49).
9. Average committed supports, per NDIS participant
‘Average committed supports, per NDIS participant’ is an indicator of governments’ objective to provide access to disability services in an efficient manner.
‘Average committed supports, per NDIS participant’ is measured at 30 June each year and concerns participants’ most recent plans at that date.
To reflect cost differences in the intensity of support required by participants with different personal characteristics, these data are disaggregated by disability type, level of functional capacity, age, and sex, and reported separately for participants with and without supported independent living (SIL).
Supported independent living is for people with higher support needs, who require some level of help at home all the time. This can include significant help throughout the day, seven days a week and overnight support.
Efficiency data are difficult to interpret. Although high or increasing expenditure per unit of output can reflect deteriorating efficiency, it can also reflect improvements in the quality or other attributes of the services provided, or an increase in the service needs of users. Similarly, low or declining expenditure per unit of output can reflect improving efficiency, or lower quality and less effective services.
To assist interpretation of these data, information on average payments, per NDIS participant and service utilisation are included in tables 15A.55-62.
Nationally, at 30 June 2022, average committed supports, per NDIS participant, was $69 000. The need for supported independent living has a material impact on NDIS package costs. For participants without supported independent living, average committed supports, per NDIS participant was $53 000, whereas average committed supports, per NDIS participant in need of supported independent living was $358 000. Data by participant characteristics (disability type, level of functional capacity, age, and sex) and jurisdiction are reported in tables 15A.51-54.
10. Unit cost of employment services
'Unit cost of employment services' is an indicator of governments’ objective to provide access to disability services in an efficient manner.
'Unit cost of employment services' is defined as the net Australian government expenditure divided by the number of users of non‑government provided employment services.
Assuming all other factors remain constant (such as service quality and accessibility), low or decreasing government expenditure per service user reflects a more efficient provision of this service.
Efficiency data are difficult to interpret. Although high or increasing expenditure per unit of output can reflect deteriorating efficiency, it can also reflect improvements in the quality or other attributes of the services provided, or an increase in the service needs of users. Similarly, low or declining expenditure per unit of output can reflect improving efficiency, or lower quality and less effective services.
Nationally, for all employment services, the estimated Australian Government contribution per service user assisted (non‑government provided employment services) was $3957 in 2021‑22 (figure 15.10) — $3938 per user of open services (employed or seeking employment in the open labour market) and $19 219 per user of supported services (employed by the service provider) (table 15A.63). Australian Government funding per user of non-government provided employment services was higher in 2021-22 compared to 2020-21 ($3458) but continued the downwards trend over the 10-year time series ($5697 in 2012-13) (table 15A.64).
11. Labour force participation and employment of people with disability
‘Labour force participation and employment of people with disability’ is an indicator of governments’ objective to help people with disability achieve economic participation.
‘Labour force participation and employment of people with disability’ is defined by three measures (each by disability status):
- Labour force participation rate defined as the number of people with disability aged 15–64 years who are in the labour force (employed or unemployed) divided by the number of people with disability aged 15–64 years
- Employment–to–population ratio defined as the number of people with disability aged 15–64 years who are employed divided by the number of people with disability aged 15–64 years
- Unemployment rate defined as the number of people with disability aged 15–64 years who are unemployed divided by the number of people with disability aged 15–64 years who are in the labour force (employed or unemployed).
High or increasing labour force participation and employment rates and low or decreasing unemployment rates for people with disability are desirable.
This indicator does not assess whether employment opportunities are appropriate or fulfilling. Data on underemployment (see the Explanatory material tab for a definition) can be found in table 15A.65. Information on Labour force participants and employment-to-population for people with a disability age 15-64 by remoteness can be found in tables 15A.69 and 15A.70.
For people aged 15–64 years with a profound or severe core activity limitation, 27.2 per cent were in the labour force and 23.9 per cent were employed in 2018; these rates are similar to 2015 but lower than 2009 (figure 15.11; tables 15A.66–67). The unemployment rate was 12.7 per cent in 2018; not significantly different to previous survey years (table 15A.68).
12. Labour force participation of primary carers of people with disability
‘Labour force participation of primary carers of people with disability’ is an indicator of governments’ objective to help carers of people with disability achieve economic participation.
‘Labour force participation of primary carers of people with disability’ is defined by three measures:
- Labour force participation rate defined as the number of primary carers of people with disability aged 15–64 years who are in the labour force (employed or unemployed) divided by the number of primary carers of people with disability aged 15–64 years
- Employment–to–population ratio defined as the number of primary carers of people with disability aged 15–64 years who are employed divided by the number of primary carers of people with disability aged 15–64 years
- Unemployment rate defined as the number of primary carers of people with disability aged 15–64 years who are unemployed divided by the number of primary carers of people with disability aged 15–64 years who are in the labour force (employed or unemployed).
High or increasing labour force participation and employment rates and low or decreasing unemployment rates for carers of people with disability are desirable.
This indicator does not provide information on whether the participation in the labour force is fulfilling. Information on the rate of underemployment can be found in table 15A.71 (see the Explanatory material tab for a definition). For information on labour force participant rates, employment-to-population and unemployment rates for primary carers of people with disability aged 15-64 by remoteness, see tables 15A.75 and 15A.76.
Nationally in 2018, the labour force participation rate and employment–to–population ratio for primary carers of people with disability aged 15–64 years was 57.0 per cent and 53.2 per cent respectively; these rates are not significantly different from 2015 and 2012 (figure 15.12; tables 15A.72–73).
Nationally, the unemployment rate for primary carers of people with disability aged 15–64 years did not change significantly between 2012 and 2018, with the rate at 7.1 per cent in 2018 (table 15A.74).
‘Social participation of people with disability’ is an indicator of governments’ objective to help people with disability achieve social participation.
‘Social participation of people with disability’ is defined by three measures:
- The proportion of people with disability aged 15–64 years who have had face‑to‑face contact with ex‑household family or friends in the previous week
- The proportion of people with disability aged 15–64 years who travelled to a social activity in the last two weeks
- The proportion of people with disability aged 5–64 years who report the main reason for not leaving home as often as they would like is their disability or condition.
A high or increasing proportion of people with disability who participate in social or community activities reflects greater inclusion in the community.
This indicator does not provide information on the degree to which the identified types of social or community activities contribute to people’s quality of life. For information on the social participation of people with disability by remoteness, see tables 15A.81, 15A.82 and 15A.84.
Social participation outcomes decreased from 2009 to 2018.
- Nationally, for people with disability aged 15–64 years, the proportion who had face‑to‑face contact with ex‑household family or friends in the previous week decreased by around 9 percentage points to 67.6 per cent (table 15A.78).
- The decrease was less for the proportion who travelled to a social activity in the last two weeks (down by 4 percentage points to 89.7 per cent; figure 15.13). Though for people with a severe or profound disability the decrease was greater (down by around 8 percentage points to 79.7 per cent; table 15A.79).
- Nationally, for people with disability aged 5–64 years, the proportion who reported the main reason for not leaving home as often as they would like is their disability or condition increased from 12.7 per cent in 2009 to 16.3 per cent in 2018 (table 15A.80). For those with severe or profound disability, the proportion was stable over this period, and was 30.9 per cent in 2018 (table 15A.83).
14. Use of mainstream services by people with disability
‘Use of mainstream services by people with disability’ is an indicator of governments’ objective that people with disability and their carers have an enhanced quality of life and enjoy choice and wellbeing.
‘Use of mainstream services by people with disability’ is defined as the proportion of people with disability who sought to access mainstream services and were able to do so confidently (that is without experiencing difficulty or discrimination). Data are reported for the following proxy measures:
- the proportion of people with disability aged 15–64 years (living in households) who experienced discrimination due to disability from service and hospitality staff in the last 12 months
- the proportion of people with disability aged 15–64 years (living in households) who avoided services due to disability in the last 12 months
- the proportion of people with disability aged 15–64 years (living in households) who could not use or use only some public transport.
Data for possible sources of discrimination include: teacher or lecturer; health staff; bus driver, rail staff or taxi driver; restaurant and hospitality staff; and sales staff. Data for possible services avoided due to discrimination include: education and medical facilities; shops, banks and other services; restaurants, cafes or bars; public transport; parks and other recreation facilities.
Data on respondents’ ability to use public transport includes people with disability aged 15-64 years only. Data exclude people not living in households and people who reported they do not leave home. When interpreting these data, users should be aware that respondents were asked to report their ability to use public transport regardless of whether it was available in their area. Therefore, these data cannot provide insight into public transport availability for people with disability or barriers within specific transport services.
Low or decreasing proportions of people with disability experiencing difficulty or discrimination is desirable.
Contextual information on the proportion of active NDIS participants with approved plans accessing mainstream supports is available in table 15A.15. For additional information on people with disability who avoided services by remoteness, see table 15A.88.
Nationally in 2018, for people with disability aged 15–64 years:
- 5.6 per cent reported experiencing unfair treatment or discrimination in the last 12 months from service and hospitality staff, due to their disability. The proportion was higher for those outside of major cities (7.0 per cent) compared to those within (4.8 per cent) (figure 15.14; table 15A.86).
- around one‑quarter (27.7 per cent) avoided services that involved interaction with service and hospitality staff, due to their disability (figure 15.14; table 15A.87)
- and 15.6 per cent reported they could not use, or could use only some, public transport (figure 15.14; table 15A.89).
15. Carer health and wellbeing
‘Carer health and wellbeing’ is an indicator of governments’ objective that people with disability and their carers have an enhanced quality of life and enjoy choice and wellbeing.
‘Carer health and wellbeing’ is defined using two measures:
- the proportion of primary carers of people with disability who feel satisfied with their caring role
- the proportion of primary carers of people with disability who do not experience negative impacts on their wellbeing due to their caring role.
A high or increasing rate of carers who feel satisfied with their caring role and who do not experience negative impacts on their wellbeing due to their caring role is desirable.
Nationally in 2018, 22.1 per cent of primary carers of people with disability were satisfied with their caring role and 43.7 per cent did not experience negative impacts on their wellbeing due to their caring role (figure 15.15).The proportion of primary carers who were satisfied with their caring role and who did not experience negative impacts on their wellbeing due to their caring role were higher for male than female carers (figure 15.15; tables 15A.90–91).
Performance indicator data for Aboriginal and Torres Strait Islander people in this section are available in the data tables listed below. Further supporting information can be found in the 'Indicator results' tab and data tables.
| Table number | Table title |
|---|---|
| Table 15A.22 | Proportion of the potential population who are participants in the NDIS, by Indigenous status, 30 June |
| Table 15A.23 | Users of Commonwealth disability employment services (aged 15–64 years), by Indigenous status |
| Table 15A.24 | Aboriginal and Torres Strait Islander users of open employment services/Employment Support Services aged 15-64 years, by age |
| Table 15A.25 | Aboriginal and Torres Strait Islander users of Disability Management Services aged 15-64 years, by age |
| Table 15A.37 | Rate of younger people admitted to permanent residential aged care per 10 000 potential population, by Indigenous status, by age |
| Table 15A.39 | Younger people who separated from permanent residential aged care to return to home/family, by Indigenous status, by age |
| Table 15A.40 | Younger people receiving permanent residential aged care, by Indigenous status, by age |
Interpreting efficiency data
This Report includes 2020‑21 expenditure data provided by Australian, State and Territory governments. Expenditure data in this Report may differ from information reported elsewhere (for example, data in this Report exclude users of specialist psychiatric disability services only). Information on differences in expenditure can be found in table 15.3.
| NSW | Vic | Qld | WA | SA | Tas | ACT | NT | Aust | ||
|---|---|---|---|---|---|---|---|---|---|---|
| Superannuation | Included |  | | | | | | | | |
| Basis of estimate | Accrual | Accrual | Accrual | Accrual | Accrual | Accrual | Accrual | Accrual | Accrual | |
| Workers compensation | Included | | | | | | | | | |
| Actual payroll tax | Included |  | |  | | | | | | |
| Basis of apportioning umbrella department costs | Included | | | | | | | | | |
| Departmental formula | | | | | | | | | | |
| % of FTE employees | | | | | | | | | | |
| Long service leave | Entitlements | | | | | | | | | |
| Basis of estimate | Accrual | Accrual | Accrual | Accrual | Accrual | Accrual | Accrual | Accrual | Accrual | |
| Depreciation | | | | | | | | | |
FTE = full time equivalent. Not applicable. Not included. Included.
Source: Australian, State and Territory governments unpublished.
Key terms
| Terms | Definition |
|---|---|
Core activities as per the 2018 ABS SDAC | Communication, mobility and self‑care. |
Disability | The United Nation’s Convention on the Rights of Persons with Disabilities, ratified by Australia on 17 July 2008, defines ‘persons with disabilities’ as those who have long term physical, mental, intellectual or sensory impairments which in interaction with various barriers may hinder their full and effective participation in society on an equal basis with others. The World Health Organisation defines ‘disabilities’ as impairments, activity limitations, and participation restrictions: an impairment is a problem in body function or structure; an activity limitation is a difficulty encountered by an individual in executing a task or action; and a participation restriction is a problem experienced by an individual in involvement in life situations. Disability is a complex phenomenon, reflecting an interaction between features of a person’s body and features of the society in which he or she lives (WHO 2009). In the ABS SDAC 2018, a person has a disability if they ‘report they have a limitation, restriction or impairment, which has lasted, or is likely to last, for at least six months and restricts everyday activities. This includes:
The third Commonwealth State/Territory Disability Agreement (CSTDA) (2003, p. 9) defined ‘people with disabilities’ as those whose disability manifests itself before the age of 65 years and for which they require significant ongoing and/or long term episodic support. For these people, the disability will be attributable to an intellectual, psychiatric, sensory, physical or neurological impairment or acquired brain injury (or some combination of these) which is likely to be permanent and results in substantially reduced capacity in at least one of the following: self‑care/management, mobility and communication. |
Employment services | Employment services comprise open employment services and supported employment services. Where users of employment services are described without further qualification, this includes people who use either or both open and supported employment services. All open employment services are now included in the Disability Employment Services (DES) program administered by the Department of Social Services (DSS). Disability Employment Services has two parts: Disability Management Services (DMS) is for job seekers with disability, injury or health condition who need assistance to find a job and occasional support to keep a job; and Employment Support Services (ESS) provides assistance to people with permanent disability and who need regular, ongoing support to keep a job. |
Geographic location | Geographic location is based on the Australian Statistical Geography Standard of Remoteness Areas, which categorises areas as ‘major cities’, ‘inner regional’, ‘outer regional’, ‘remote’, ‘very remote’ and ‘migratory’. The criteria for Remoteness Areas are based on the Accessibility/Remoteness Index of Australia, which measures the remoteness of a point based on the physical road distance to the nearest urban centre in each of five size classes (ABS 2011b). The ‘outer regional and remote/very remote’ classification used in this Report was derived by adding outer regional, remote and very remote data. |
Government and non‑government provided services | Government provision means that a service is both funded and directly provided by a government department, agency or local government. Non‑government provision is a service purchased or part‑funded by a government department or agency, but provided by a non‑government organisation. Non‑government service providers may receive funds from the private sector and the general public in addition to funding, grants and input tax concessions (such as payroll tax exemptions) from governments. Data on funds that non‑government service providers receive from the private sector and the general public are outside the scope of this Report. |
Informal carer | ABS informal assistance/providers: unpaid help or supervision that is provided to persons with disability or persons aged 65 years and over. It only includes assistance that is provided because of a person’s disability or because they are older. Informal assistance may be provided by family, friends, or neighbours. For the Survey of Disability, Ageing and Carers, any assistance received from family or friends is considered to be informal regardless of whether or not the provider was paid, such as through the Carer Payment or other allowances. It does not include providers whose care is privately organised (ABS 2019). Section 5 of the Carer Recognition Act (Cwlth) 2010 defines the term ‘carer’ for the purposes applying to that legislation. See also primary carer. |
Labour force participation rate for people with a profound or severe core activity limitation | The total number of people with a profound or severe core activity limitation in the labour force (where the labour force includes employed and unemployed people), divided by the total number of people with a profound or severe core activity limitation who are aged 15–64 years, multiplied by 100. An employed person is a person who, in his or her main job during the remuneration period (reference week):
An unemployed person is a person aged 15–64 years who was not employed during the remuneration period, but was looking for work. |
Mild core activity limitation | The person needs no help and has no difficulty with any of the core activity tasks, but:
|
Moderate core activity limitation | The person needs no help, but has difficulty with a core activity task (as per the 2018 SDAC). |
NDA potential population | The ‘potential population’ is the number of people with the potential to require disability support services, including people who meet service eligibility criteria but who do not access services. The potential population is the number of people aged 0–64 years (and Aboriginal and Torres Strait Islander people aged 0–49 years) who are most appropriately supported by disability services, require ongoing and/or long-term episodic support, have a permanent or chronic impairment, and substantially reduced capacity in one or more core activities. The potential population is calculated using national age and sex-specific rates of severe or profound core activity limitation from the ABS Survey of Disability, Ageing and Carers (SDAC). The potential population is recalculated following each survey, meaning a break in series compared to previous potential populations. The SDAC was conducted in 1998, 2003, 2009, 2012, 2015 and 2018. Basic community care Estimates of the potential population for basic community care employ the general definition outlined above. Employment services For supported employment services, the potential population is restricted to people aged 15–64 years participating in the labour force. For open employment services, the potential population is not used; instead, an estimate of all people with disability and an employment restriction aged 15–64 years is used. The supported employment potential population is used when combined employment services denominators or rates are presented. Disability Employment Services (DES) is intended for all people with disability who require assistance in obtaining or maintaining mainstream employment. This is distinct from Australian Disability Enterprises, which employs people with a disability that restricts them from engaging in mainstream employment. DES is available for all people with a disability. The SDAC extract for this type of service is information on all people with a disability in SDAC with an employment restriction, regardless of the criteria used in generating the more restricted potential population. Selected equity groups Potential populations are estimated for each special needs group (outer regional and remote/very remote areas, Aboriginal and Torres Strait Islander people and people born in a non-English speaking country) and for people outside of the special needs groups (major cities and inner regional areas, non-Indigenous and people born in an English speaking country). Aboriginal and Torres Strait Islander people have significantly higher disability prevalence rates and greater representation in some specialist disability services than non-Indigenous people. There are also differences in the proportion of the population who are Aboriginal and Torres Strait Islander across jurisdictions. Therefore, an Aboriginal and Torres Strait Islander factor adjustment is undertaken when estimating the potential population. The Aboriginal and Torres Strait Islander factor was multiplied by the ‘expected current population estimate’ of people in the potential population in each jurisdiction to derive the ‘potential population’. Data assumptions Data measuring the potential population is not available for each reported year and so has been estimated from several sources based on the following assumptions:
For more information on calculating the potential population, see appendix A of SCRGSP (2013). |
NDIS potential population | This population includes those with significant and enduring support needs who are eligible for individualised support under the NDIS. It is derived by the NDIA, based on the method used in the Productivity Commission report Disability Care and Support, released in 2011. To estimate the number of people with significant and enduring support needs who would be eligible for individualised support, in Disability Care and Support the Productivity Commission:
Using data from the 2009 SDAC, the Commission estimated that just over 410 000 persons would be eligible for support under the NDIS in 2009. On at least an annual basis, the emerging experience of the NDIS is compared to the initial estimates of the Productivity Commission, to determine whether an adjustment to the potential population is necessary. In 2018, the NDIA further developed experience‑based modelling for this purpose. Historically ABS population growth rates were used to arrive at the total potential population at a point in time. This year, the “Budget 2022-23 population projections, Australia, 2021-22 to 2032-33 from the Centre for Population Projections” were used. For special needs groups, the NDIA uses ABS Census to obtain information on the number of individuals with ‘need for assistance’, which is available by CALD and Indigenous status, and also allows for regional variation. The total potential population is then allocated by LGA, sex, Indigenous and CALD status using the ‘need for assistance’ variable distribution. In the 2021-22 Annual Financial Sustainability Report (AFSR), the NDIA projected a higher future steady state potential population for the NDIS than in the previous 2020-21 AFSR, resulting in an increase in the estimated NDIS potential population between June 2021 and June 2022. |
Payroll tax | A tax levied on employers based on the value of wages and certain supplements paid or payable to, or on behalf of, their employees (SCRCSSP 1999). Payroll tax arrangements for government funded and delivered services differ across jurisdictions. Differences in the treatment of payroll tax can affect the comparability of unit costs across jurisdictions and services. These differences include payroll tax exemptions, marginal tax rates, tax free thresholds and clawback arrangements (see SCRCSSP 1999). There are two forms of payroll tax reported: actual — payroll tax actually paid by non‑exempt services imputed — a hypothetical payroll tax amount estimated for exempt services. A jurisdiction’s estimate is based on the cost of salaries and salary related expenses, the payroll tax threshold and the tax rate. |
Primary carer | ABS SDAC primary carer: A primary carer is a person who provides the most informal assistance to a person with one or more disabilities, with one or more of the core activities of mobility, self‑care, or communication. (ABS 2019). See also informal carer. |
Primary disability group | Disability group that most clearly expresses the experience of disability by a person. The primary disability group can also be considered as the disability group causing the most difficulty to the person (overall difficulty in daily life, not just within the context of the support offered by a particular service). |
Profound core activity limitation | The person is unable to do, or always needs help with, a core activity task. (as per the 2018 SDAC). |
Real expenditure | Actual expenditure (accrual) adjusted for changes in prices, using the General Government Final Consumption Expenditure (GGFCE) deflator, and expressed in terms of current year dollars. |
| Seclusion | Seclusion is the confinement of a person with disability to a room or physical space to restrict movement and prevent a person from voluntarily leaving. |
Schooling or employment restriction | Schooling restriction: as a result of disability, being Unable to attend school, attends a special school, attends special classes at an ordinary school, needs at least one day a week off school on average, has difficulty at school. Employment restriction: as a result of disability, permanently unable to work, restricted in the type of work they can or could do, need, or would need, at least one day a week off work on average, restricted in the number of hours they can, or could, work, requires special equipment, modified work environment or special arrangements, needs ongoing assistance or supervision, would find it difficult to change jobs or get a preferred job, needs assistance from a disability job placement program or agency. |
Service | A service is a support activity provided to a service user, in accord with the NDA. Services within the scope of the collection are those for which funding has been provided during the specified period by a government organisation operating under the NDA. |
Service user | A service user is a person with disability who receives a specialist disability service. A service user may receive more than one service over a period of time or on a single day. |
Severe core activity limitation | The person sometimes needs help with a core activity task, and/or has difficulty understanding or being understood by family or friends or can communicate more easily using sign language or other non‑spoken forms of communication. (as per the SDAC 2018). |
Supported independent living (SIL) | Supported independent living helps people with disability remain in their homes. It includes help or supervision with daily tasks, like personal care or cooking meals. Supported independent living is for people with higher support needs, who need some level of help at home all the time. |
| Restraint | Mechanical restraint The application of devices (including belts, harnesses, manacles, sheets and straps) on a person’s body to restrict his or her movement. It does not include the use of furniture (including beds with cot sides and chairs with tables fitted on their arms) except where these devices are used solely for the purpose of restraining a person’s freedom of movement. The use of a medical or surgical appliance for the proper treatment of physical disorder or injury is not considered mechanical restraint. Physical restraint The application of hands‑on immobilisation by health care staff to restrict or subdue movement of a person’s body for the primary purpose of influencing behaviour. Physical restraint does not include the use of a hands-on technique in a reflexive way to guide or redirect a person away from potential harm/injury, consistent with what could reasonably be considered the exercise of care towards a person. Environmental restraint Restricting a person’s free access to all parts of their environment, including items or activities (for example, locking doors and cupboards, restricting access to items such as television or games). Chemical restraint Medication given primarily to control a person’s movements or behaviour, rather than to treat a mental illness or physical condition. Chemical restraint may involve the administration of higher than usual doses of a person’s regular medication; or the administration of psychotropic medication (alone or in combination) to a person who does not have a diagnosed mental illness. Appropriate use of medications to reduce or manage symptoms of diagnosed anxiety, depression or psychosis is not chemical restraint. Some medications that are used to reduce symptoms of physical conditions or medically identified major mental illnesses have side effects. This may include sedating the person to whom they are given. |
Underemployment | Underemployed people are defined as persons with disability aged 15–64 years who are employed and usually work less than 35 hours per week, who wanted to work more hours and would be able to start work with more hours in the next 4 weeks. |
References
ABS (Australian Bureau of Statistics), 2021, Aboriginal and Torres Strait Islander people with disability, https://www.abs.gov.au/articles/aboriginal-and-torres-strait-islander-people-disability (accessed 15 November 2022).
—— 2021, Characteristics of National Disability Insurance Scheme (NDIS) participants, 2019: Analysis of linked data, https://www.abs.gov.au/articles/characteristics-national-disability-insurance-scheme-ndis-participants-2019-analysis-linked-data (accessed 4 October 2021).
—— 2019, Disability, Ageing and Carers Australia: Summary of Findings 2018, Cat. no. 4430.0, Canberra.
—— 2016, Disability, Ageing and Carers Australia: Summary of Findings 2015, Cat. no. 4430.0, Canberra.
—— 2013, Disability, Ageing and Carers Australia: Summary of Findings 2012, Cat. no. 4430.0, Canberra.
—— (Australian Bureau of Statistics) 2011a, Disability, Ageing and Carers Australia: Summary of Findings 2009, Cat. no. 4430.0, Canberra.
—— 2011b, Australian Statistical Geography Standard (ASGS): Volume 5 ‑ Remoteness Structure, Cat. no. 1270.0.55.005, Canberra.—— 2012, Disability support services 2010‑11: Services provided under the National Disability Agreement, DIS 60. Canberra.
—— 2007, Disability Support Services 2005‑06: National Data on Services Provided under the CSTDA/NDA, Cat. no. DIS 51, Canberra.
CSTDA (Commonwealth State/Territory Disability Agreement) 2003, Agreement between the Commonwealth of Australia and the States and Territories of Australia in Relation to Disability Services, Australian Government Department of Family and Community Services, Canberra.
COAG (Council of Australian Governments) 2012, National Disability Agreement, https://federalfinancialrelations.gov.au/sites/federalfinancialrelations.gov.au/files/2021-05/national-disability-agreement.rtf (accessed 8 December 2017).
DSS (Department of Social Services) 2022, Department of Social Services 2021‑22 Annual Report, Commonwealth of Australia, Canberra.
NDIA (National Disability Insurance Agency), 2022, NDIS Quarterly Report to disability ministers 30 June 2022 Full report (Q4 2021-2022) https://www.ndis.gov.au/about-us/publications/quarterly-reports (accessed 10 October 2022).
—— 2021a, Quarterly Report to COAG Disability Reform Council, 30 June 2021 https://www.ndis.gov.au/about-us/publications-and-reports/quarterly-reports.html (accessed 4 October 2021).
—— 2021b, Support for Decision Making consultation, https://www.ndis.gov.au/community/have-your-say/support-decision-making-consultation (accessed 4 October 2021).
—— 2020, Governance, https://www.ndis.gov.au/about-us/governance (accessed 12 November 2020).
—— 2019, Continuity of Support, https://www.ndis.gov.au/applying-access-ndis/people-receiving-supports-other-governments/continuity-support (accessed 12 November 2020).
NDIS Quality and Safeguards Commission 2020, Activity Report 1 July 2019 to 30 June 2020, https://www.ndiscommission.gov.au/sites/default/files/2022-02/activity-report-jul19-jun20.pdf (accessed 15 October 2020).
NDS (National Disability Services) 2022, State of the Disability Sector Report, https://www.nds.org.au/index.php/about/state-of-the-disability-sector-report (accessed 14 December 2022).
—— 2018, Australian Disability Workforce Report, 3rd edition, July.
SCRCSSP (Steering Committee for the Review of Commonwealth/State Service Provision) 1999, Payroll Tax in the Costing of Government Services, AusInfo, Canberra.
SCRGSP (Steering Committee for the Review of Government Service Provision) 2013, National Agreement performance information 2012‑13 — National Disability Agreement, Productivity Commission, Canberra.
WHO (World Health Organization) 2009, Disabilities, Health topics, Geneva, https://www.who.int/topics/disabilities/en/ (accessed 13 October 2009).
Impact of COVID-19 on data for the Services for people with disability section
COVID-19 may affect data in this Report in a number of ways. This includes in respect of actual performance (that is, the impact of COVID-19 on service delivery from 2020 to 2022 which is reflected in the data results), and the collection and processing of data (that is, the ability of data providers to undertake data collection and process results for inclusion in the Report).
A PDF of Part F Community services can be downloaded from the Part F sector overview page.
13. Social participation of people with disability