Report on Government Services 2022
Part F, SECTION 15: RELEASED ON 25 JANUARY 2022
15 Services for people with disability
This section is presented in a new online format. Dynamic data visualisations replace the static chapter format used in previous editions. Machine readable data are also available for download. A guide is available on accessing information in the new format.
Impact of COVID-19 on data for the Services for people with disability section
COVID-19 may affect data in this Report in a number of ways. This includes in respect of actual performance (that is, the impact of COVID-19 on service delivery during 2020 and 2021 which is reflected in the data results), and the collection and processing of data (that is, the ability of data providers to undertake data collection and process results for inclusion in the Report).
For the Services for people with disability section, there are no significant changes to the data as a result of COVID-19.
This section reports on the Australian, State and Territory governments’ assistance provided to people with disability and their carers. Performance reporting currently focuses on assistance provided by governments to people with disability via the National Disability Insurance Scheme and through specialist disability services under the National Disability Agreement, as well as the broad social and economic outcomes of people with disability and their use of mainstream services.
The Indicator Results tab uses data from the data tables to provide information on the performance for each indicator in the Indicator Framework. The same data are also available in CSV format.
- Context
- Indicator framework
- Indicator results
- Indigenous data
- Key terms and references
Objectives for services for people with disability
Disability services aim to help people with disability and their carers have an enhanced quality of life, enjoy choice and wellbeing, achieve independence, social and economic participation, and full inclusion in the community.
Under the NDIS, governments aim to achieve this objective through the provision of an NDIS which:
- enables people with disability to exercise choice and control in the pursuit of their goals and the planning and delivery of their supports
- provides reasonable and necessary supports including early intervention supports
- promotes the provision of high quality and innovative supports
- provides timely decisions on access by applicants to the Scheme.
For specialist disability services provided outside the NDIS, governments aim to achieve this objective by providing access to disability services:
- that meet the individual needs of people with disability and their carers
- that provide skills and support to people with disability to enable them to live as independently as possible
- that meet a particular standard of quality
- on the basis of relative need
- that assist families and carers in their caring role.
Governments aim to meet these objectives in an equitable and efficient manner.
Performance reporting on the NDIS is being progressively developed and introduced to the RoGS as the number of disability‑specific services provided directly by states and territories (primarily under the NDA) decreases.
Service overview
Assistance is provided by governments to people with disability and their carers through both the NDIS and specialist disability services provided under the NDA.
The NDIS provides reasonable and necessary supports to people with a permanent and significant disability who need assistance with everyday activities. The scheme is underpinned by an insurance model, and each individual seeking access is assessed according to a common set of criteria. Individuals who are deemed eligible receive a package of funding to purchase the supports identified in their individualised plan. The NDIS was established under the National Disability Insurance Scheme Act 2013 (Cwlth).
Services and supports provided to NDIS participants are regulated by the NDIS Quality and Safeguards Commission. Its role includes provider registration, complaints management and reportable incidents, behaviour support, and compliance with practice standards and the NDIS code of conduct. During 2020-21, the NDIS Commission received 7231 complaints, and was notified of 1 044 851 reportable incidents by NDIS providers1 (NDIS Quality and Safeguards Commission 2021). The NDIA also receives complaints relating to the Scheme, and in some jurisdictions there are agencies to which complaints about disability services can be made.
The NDA, effective from 1 January 2009 and revised in 2012, provides the national framework and key areas of reform for the provision of government support and services for people with disability. A range of specialist disability services were provided by governments under the NDA, but with full transition to the NDIS having occurred in all jurisdictions by October 2020 (except WA), the number and range of specialist disability services provided by jurisdictions under the NDA has declined. Currently, specialist disability services under the NDA primarily include:
- employment services, delivered by the Australian Government
- Basic Community Care (BCC) services2 assist people with disability or a chronic health condition aged under 65 years (and Aboriginal and Torres Strait Islander people aged under 50 years) to live independently and to actively participate and engage in their community.
People with disability have the same right of access to mainstream services as all Australians, consistent with the goals of the new Australia’s Disability Strategy (ADS), launched on 3 December 2021. Progress against the ADS will be publicly reported on an annual basis. Data on the participation of people with disability in various government services can be found in other sections of this Report (sections 3, 4, 5, 14, 18, 19 and sector overview G).
- Note that because the number of reported incidents include multiple notifications of the same matter, allegations of incidents, and instances that occurred but where no harm to the person resulted, the number of reports received does not correlate to the number of actual instances of harm to a person with disability (NDIS Quality and Safeguards Commission 2020). Locate Footnote 1 above
- In WA, services for younger people transitioned from the Home and Community Care (HACC) Program to the NDIS from July 2017 to June 2020. HACC is now only available to younger people who are already recipients of HACC services. The Victorian Government assumed full funding and management responsibilities from 1 July 2016 through the Home and Community Care (HACC) Program for Younger People, providing basic community care services to people with physical and/or psychosocial functional impairment related to disability (below the threshold for NDIS eligibility) or for impairments related to chronic illness. The Tasmanian Department of Health has funded and managed the Tasmanian HACC Program from 1 July 2012. This program funds a range of basic community support services targeted at younger people who live in the Tasmanian community and whose capacity for independent living is at risk due to a chronic health condition or acute health event; moderate or mild functional impairment or deterioration of an ongoing health condition. Locate Footnote 2 above
Roles and responsibilities
The Australian, State and Territory governments have different but complementary roles and responsibilities:
- All governments share responsibility for NDIS policy, funding and governance (NDIA 2020).
- Under the NDA, State and Territory governments are responsible for the provision of specialist disability services, except disability employment services. States and territories have full financial and operational responsibility for BCC services for people with disability aged under 65 years (and Aboriginal and Torres Strait Islander people aged under 50 years).
- The Australian Government is responsible for the oversight and funding of employment services for people with disability and the provision of income support.
Funding
In 2020-21, total government contributions to the pool of funding for the NDIS was $23.2 billion, while expenditure on specialist disability services provided outside the NDIS was approximately $2.2 billion (table 15A.1). Data are available by source of funding in tables 15A.2 and 15A.3, but due to differences in funding information provided across jurisdictions (impacted in large part by the NDIS transition) meaningful comparisons cannot be made. For all jurisdictions, contributions to the NDIS formed the bulk of their funding for disability (table 15A.6).
Total committed support3 to the NDIS for 2020-21 was $32.1 billion, with $22.1 billion paid to participants to date — representing a utilisation rate (the ratio of total amounts paid to total funds committed for plan supports) of 69 per cent (NDIA 2021a). For the life of the Scheme up to 30 June 2021, utilisation rates across the states and territories ranged from 67 per cent to 73 per cent (table 15.1).
The rate of utilisation of the NDIS by participants can give an indication of the ability of participants to access supports (tables 15A.74–77). It may also provide insight into where service availability might be low and where providers could expand their provision of supports.
Outlays on income support payments and allowances to people with disability and their carers in 2020-21 (on an accrual basis) amounted to $28.2 billion, comprising $18.4 billion for the Disability Support Pension, $6.5 billion for the Carer Payment, $2.5 billion for the Carer Allowance, $594.5 million for the Carer Supplement, $186.7 million for the Child Disability Assistance Payment, and $36.2 million for the Mobility Allowance (DSS 2021).
- Committed support is the amount allocated to specific plans – not all committed support in a plan is used by a participant. This is also distinct from the amounts contributed by the Commonwealth, State and Territory governments in a given year to fund the NDIS. Utilisation of the support is included in the financial year it was committed, but is only counted when the support is actually paid for (which can be some time after it is provided). Therefore, the utilisation rate for a given financial year can increase over time. Locate Footnote 3 above
Size and scope
The ABS estimates that 4.4 million Australians or 17.7 per cent of the population had a disability in 2018 (for those aged under 65 years, this was 2.4 million Australians or 11.6 per cent of this age group), and an estimated 5.7 per cent had a profound or severe core activity limitation (for those aged under 65 years this was 3.5 per cent) — these results are similar to 2015, 2012 and 2009 (ABS 2019, 2016, 2013, 2011a). Males and females are similarly affected by disability (for all ages, 17.6 per cent and 17.8 per cent respectively; for those aged under 65 years, 11.9 per cent and 11.4 per cent respectively) (ABS 2019).
Aboriginal and Torres Strait Islander people experience higher rates of disability than non Indigenous people. In 20154, 7.3 per cent of all Aboriginal and Torres Strait Islander people had a profound or severe core activity limitation — around 1.5 times the proportion for non Indigenous people (ABS 2016).
Table 15A.7 contains additional information on disability prevalence.
National Disability Insurance Scheme participants
Nationally, as at 30 June 2021, 466 619 NDIS participants had an approved plan (table 15A.8)5. People identifying as Aboriginal or Torres Strait Islander made up 6.9 per cent of participants (NDIA 2021a). Information on the characteristics of NDIS participants can be found in tables 15A.8-11. At the end of June 2021, the most commonly reported disability of NDIS participants was autism (32.5 per cent), followed by intellectual disability (19.6 per cent) (table 15A.8). Additional information on NDIS participants’ access to mainstream services and satisfaction with the NDIS can be found in tables 15A.72-73, while information on the characteristics of active NDIS providers can be found in table 15A.78. An analysis of the characteristics of NDIS participants linked to the Multi-Agency Data Integration Project is contained in Characteristics of National Disability Insurance Scheme participants, 2019: Analysis of linked data (ABS (2021)).
Users of Commonwealth employment services
In 2020-21, a total of 176 274 people used Disability Management Services (table 15A.31), and 223 607 used Employment Support Services (table 15A.30).
Potential Population
An estimate of the population with the potential to require specialist disability services is referred to as the ‘NDA potential population’ — the number of people aged 0–64 years who could most appropriately be supported by specialist disability services, require ongoing and/or long term episodic support, have a permanent or chronic impairment and substantially reduced capacity in one or more core activities (see 'Key terms and references' tab for definitions). Note that this is distinct from the NDIS potential population; an estimate of the number of people with significant and enduring support needs who would be eligible for support under the NDIS. Table 15.2 shows the NDIS potential population and the NDA potential population.
Use of Basic Community Care
In 2020-21, for the four jurisdictions for which BCC service user data were available6, there were just over a combined 70 000 service users (table 15A.12). For the three jurisdictions for which data on hours were available, these users received around 1.3 million hours of service7,8 (table 15A.13). The majority of service hours were for nursing care and domestic assistance (26 per cent and 19 per cent respectively) (table 15A.13).
The quality of the BCC data reported varies across jurisdictions and comparisons should be made with caution.
Disability support workforce
A survey of more than 150 organisations employing disability support workers found that in March 2018 (most recent available data), permanent workers made up 48 per cent of the disability support workforce (NDS 2018). This survey also revealed that the female to male ratio in the disability support workforce is 7:3, and that workers over 45 years of age constitute roughly one third of the total workforce.
Income support and allowances
At June 2021, there were around 753 000 recipients of the Disability Support Pension, 300 100 recipients of the Carer Payment, 634 200 recipients of the Carer Allowance, 645 600 recipients of the Carer Supplement (paid to Carer Payment and Carer Allowance recipients), 162 200 recipients of the Child Disability Assistance Payment and 12 400 recipients of the Mobility Allowance (table 15A.14).
Informal carers
Family and friends provide most of the help and/or care that people with disability receive. Information about informal carers enables governments to plan ahead for the future demand for services that support carers and the people they assist (see 'Key terms and references' tab for different definitions of informal carers across collections).
In 2018, an estimated 861 600 informal primary carers (of which 628 400 were aged less than 65 years) provided the majority of assistance with self care, mobility and communication for people with disability (ABS 2019).
- Data from the most recent survey of disability prevalence in 2018 did not have a sufficient sample to provide an estimate for Aboriginal and Torres Strait Islander people. Locate Footnote 4 above
- The NDIS participants with approved plans includes only active participants. Inactive participants are those who have exited the Scheme. As at 30 June 2021, 19,122 participants with approved plans have exited the Scheme. Locate Footnote 5 above
- NSW data for State/Territory government service users were not available for 2018-19 because NSW transitioned to the NDIS in 2017–18. SA data for State/Territory government service users were not available for 2018-19 as most of these service users had transitioned to the NDIS. The ACT transitioned to the NDIS in 2016–17. Locate Footnote 6 above
- Service user data were available for Victoria, Queensland, WA and Tasmania. Locate footnote 7 above
- Data on hours by service type were not available for Queensland. Locate Footnote 8 above
The performance indicator framework provides information on equity, efficiency and effectiveness, and distinguishes the outputs and outcomes of services for people with disability.
The performance indicator framework shows which data are complete and comparable in this Report. For data that are not considered directly comparable, text includes relevant caveats and supporting commentary. Section 1 discusses data comparability and completeness from a Report-wide perspective. In addition to the contextual information for this service area (see Context tab), the Report’s statistical context (Section 2) contains data that may assist in interpreting the performance indicators presented in this section.
Improvements to performance reporting for services for people with disability are ongoing and include identifying data sources to fill gaps in reporting for performance indicators and measures, and improving the comparability and completeness of data.
Outputs
Outputs are the services delivered (while outcomes are the impact of these services on the status of an individual or group) (see section 1). Output information is also critical for equitable, efficient and effective management of government services.
Outcomes
Outcomes are the impact of services on the status of an individual or group (see section 1).
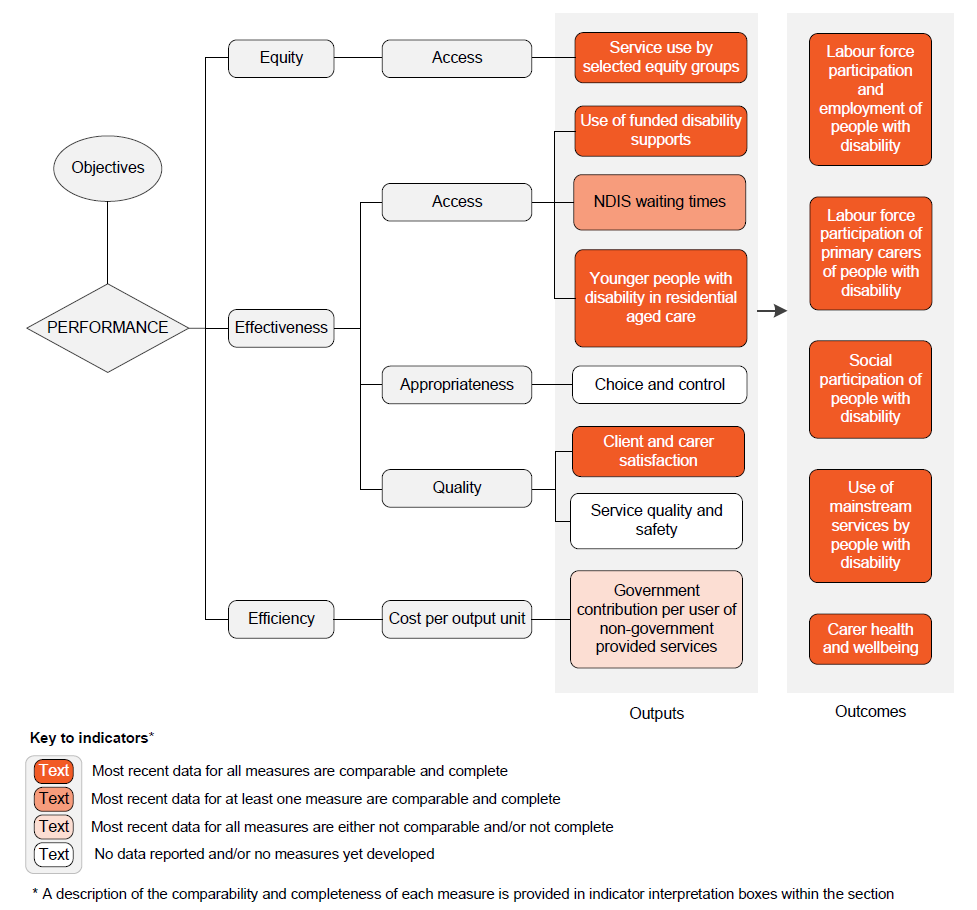
An overview of the Services for people with disability performance indicator results are presented. Different delivery contexts, locations and types of clients can affect the equity, effectiveness and efficiency of services for people with disability.
Information to assist the interpretation of these data can be found with the indicators below and all data (footnotes and data sources) are available for download from Download supporting material. Data tables are identified by a ‘15A’ prefix (for example, table 15A.1).
All data are available for download as an excel spreadsheet and as a CSV dataset — refer to Download supporting material. Specific data used in figures can be downloaded by clicking in the figure area, navigating to the bottom of the visualisation to the grey toolbar, clicking on the 'Download' icon and selecting 'Data' from the menu. Selecting 'PDF' or 'Powerpoint' from the 'Download' menu will download a static view of the performance indicator results.
1. Service use by selected equity groups
‘Service use by selected equity groups’ is an indicator of governments’ objective to provide disability services in an equitable manner.
‘Service use by selected equity groups’ is defined as the proportion of service users per 1000 potential population in a particular selected equity group, compared with the proportion of service users per 1000 potential population outside that selected equity group.
A service user is a person with disability who is an active NDIS participant (with an approved individualised NDIS Plan) or a person with disability who received at least one NDA funded employment service.
The potential population is an estimate of the number of people with the potential to require disability services at a point in time (typically as at 30 June). (Further details on potential populations can be found in 'the 'Key terms and references' tab.)
Data are reported for three selected equity groups:
- People from outer regional and remote/very remote areas
- People identified as Aboriginal and Torres Strait Islander people
- People from culturally and linguistically diverse (CALD) backgrounds (defined as people who were born in a non‑English speaking country).
While a lower proportion within the selected equity group relative to outside the selected equity group can indicate reduced access, it can also represent strong alternative informal support networks (and a consequent lower level of otherwise unmet need), or a lower tendency of people in a selected equity group to choose to access disability services. Similarly, a higher proportion can suggest poor service targeting, the lack of alternative informal support networks, or a greater tendency of people in a selected equity group to choose to access disability services.
This indicator does not provide information on whether the services were appropriate for the needs of the people receiving them, or correctly targeted on the basis of relative need. The indicator does not take into account differences in the level of informal assistance that is available for people in selected equity groups and outside the selected equity groups.
Nationally at 30 June 2021, the proportion of the potential population who were participants in the NDIS was:
- lower in remote areas than in major cities and regional areas
- higher for Aboriginal and Torres Strait Islander people than for non‑Indigenous people
- lower for people from a CALD background compared to people from a non‑CALD background9 (figure 15.1a).
Nationally in 2020‑21, the proportion of the potential population who used Commonwealth disability employment services10 was:
- lower in major cities and inner regional areas than in outer regional and remote areas
- lower for Aboriginal and Torres Strait Islander people compared to non‑Indigenous people
- lower for people born in a non‑English speaking compared to an English speaking country (figure 15.1b).
- CALD status is defined as country of birth is not Australia, New Zealand, the United Kingdom, Ireland, the United States of America, Canada or South Africa, or primary language spoken at home is not English. Locate Footnote 9 above
- Data reported for Commonwealth disability employment services include users of Disability Employment Services (made up of Employment support services/open employment services and Disability Management Services) and Australian Disability Enterprises or supported employment services. Locate Footnote 10 above
2. Use of funded disability supports
‘Use of funded disability supports’ is a proxy indicator of governments’ objective to provide access to disability services on the basis of relative need.
‘Use of funded disability supports’ is defined as the number of funded disability service users divided by the potential population for that service.
A service user is a person with disability who is an active NDIS participant (with an approved individualised NDIS Plan) or who uses disability employment services. The potential population is an estimate of the number of people with the potential to require funded disability supports at some time. (Further details on the potential populations can be found in the 'Key terms and references' tab.)
For the NDIS, a high or increasing proportion of the potential population participating in the Scheme indicates greater access to the Scheme.
For disability employment services, a high or increasing proportion of the estimated potential population using a particular service indicates greater access to that service.
Information on the proportion of the potential population and the proportion of primary carers who report a need for more formal assistance are available in tables 15A.25–28. This indicator does not provide information on whether the services are appropriate for the needs of the people receiving them, or accessed by those most in need.
Nationally at 30 June 2021, the number of people with disability accessing the NDIS as a proportion of the potential population was 75.6 per cent — an increase of around one-quarter from 30 June 2019, which reflects in part the transition to the NDIS for the remaining jurisdictions during this period (figure 15.2a).
Nationally in 2020‑21, for people aged 15–64 years with disability and with an employment restriction:
- 12.5 per cent were using NDA Disability Management Services (DMS) — an increase from 8.3 per cent in 2014‑15
- 15.9 per cent were using NDA open employment services (Employment Support Services (ESS)) in 2020‑21 — an increase from 8.6 per cent in 2014‑15 (figure 15.2b).
3. NDIS waiting times
‘NDIS waiting times’ is an indicator of governments’ objective to provide timely decisions on access by applicants to the NDIS.
‘NDIS waiting times’ measures the time taken for individuals to obtain access to the NDIS and is defined by two measures:
- ‘Timeliness of NDIS eligibility decision’ is defined as the amount of time taken to determine a person’s eligibility for the NDIS, from the time of submission of an access request to the NDIS by an individual, to the NDIA’s decision on the access request.
- ’Timeliness of first plan approval’ is defined as the amount of time taken to complete an approval of a participant’s first plan in the NDIS, measured from the point at which an access decision has been made by the Agency, to the point of first plan approval by the Agency.
Short or decreasing times for making access decisions to the NDIS are desirable.
Nationally in the June quarter 2021, it took an average of seven days for a decision to be made on access to the NDIS. For approvals of first plans, it took an average of 49 days, a decrease from 69 days in 2020 (figure 15.3).
4. Younger people with disability in residential aged care
‘Younger people with disability in residential aged care’ is an indicator of governments’ objective to provide access to disability services on the basis of relative need; and through the NDIS, to provide reasonable and necessary supports, including early intervention supports.
‘Younger people with disability in residential aged care’ is defined as the rate of non‑Indigenous persons aged 0–64 years and Aboriginal and Torres Strait Islander persons aged 0–49 years admitted to permanent residential aged care per 10 000 potential population. Further details on the potential population can be found in the 'Key terms and references' tab.
These data should be interpreted with care, as some younger people choose to remain in residential aged care for a variety of reasons, such as:
- their physical and nursing needs can be best met in residential aged care
- they are satisfied with their current living situation (that is, it is their preferred facility)
- the facility is located close to family and friends
- it is a familiar home environment.
Nationally in 2020‑21, the rate of people aged 0–64 years admitted to permanent residential aged care was 12.3 per 10 000 potential population, a decrease from 2019-20 and less than half the rate of 2018-19 (figure 15.4). Of those people aged 0–64 years admitted to permanent residential aged care, 93.3 per cent were aged 50 years or over (table 15A.34).
Data on the number of younger people receiving and separating from residential aged care to return to home/family are available in tables 15A.35–36. Data on the number of younger people receiving residential aged care by Indigenous status are available in table 15A.37. Data on State and Territory government expenditure for younger people with disability in residential aged care is reported in table 14A.3, of section 14 in this report.
Although data on the disability status of young people entering, receiving, or exiting residential aged care are not available, table 15A.38 contains information on the subset of young people in residential aged care who are NDIS participants.
5. Choice and control
‘Choice and control’ is an indicator of governments’ objective under the NDIS to enable people with disability to exercise choice and control in the pursuit of their goals and the planning and delivery of their supports.
‘Choice and control’ is defined as the proportion of NDIS participants with an active plan in place, who experience independence, and choice and control over their care.
A number of potential measures have been identified from the NDIS Outcomes Framework — longitudinal surveys capturing information on progress of active NDIS participants, their families and carers. The suitability of the following are being investigated for possible future reporting:
- the proportion of active NDIS participants who: have a genuine say in decisions about themselves; are happy with the level of independence/control they have now; choose who supports them; choose what they do each day; have the opportunity to participate in a self‑advocacy group meeting; want more choice and control in their life
- the proportion of carers of active NDIS participants who say: they feel in control selecting services; their child is able to tell them what he/she wants.
High or increasing proportions of NDIS participants with an active plan in place, who experienced independence and control of their care, is desirable.
Data in table 15A.39 have been included as preliminary information subject to further investigation regarding suitability for future performance measures. The NDIA are currently developing a new Support for Decision Making policy that will aim to increase the opportunity for participants to be actively involved in making decisions about their lives and to exercise real choice and control (NDIA 2021b).
Nationally, just over half (55 per cent) of active NDIS participants aged 15–64 years with an initial plan approved between 1 July 2016 and 30 June 2021 indicated that they get to choose who supports them. And 39 per cent of families/carers say they feel in control selecting services for active NDIS participants in this age group. In 2019‑20, these proportions were 53 per cent and 39 per cent respectively (table 15A.39).
6. Client and carer satisfaction
‘Client and carer satisfaction’ is an indicator of governments’ objective to provide access to disability services that meet a particular standard of quality; and under the NDIS, to promote the provision of high quality and innovative supports.
‘Client and carer satisfaction’ is defined by four measures:
- the proportion of people with disability aged 15–64 years who are satisfied with the quality of assistance received from organised and formal services in the last six months
- the proportion of people with disability aged 15–64 years who are satisfied with the range of organised and formal service options available
- the proportion of primary carers (of people with disability aged 0–64 years) who are satisfied with the quality of assistance received from formal services, by the person with disability and by the carer in the last six months
- the proportion of primary carers (of people with disability aged 0–64 years), who are satisfied with the range of formal service options available to help them in their caring role.
Care should be taken in interpreting results as the data are not able to distinguish between disability and mainstream services.
A high or increasing proportion of clients and carers who are satisfied is desirable as it suggests that the service received was of a higher quality.
Nationally in 2018, of people aged 15–64 years with disability who received formal services in the previous six months, 76.6 per cent were satisfied with the quality of assistance they received (figure 15.5; table 15A.40), and 49.1 per cent were satisfied with the range of services received (table 15A.43). These figures were not significantly different from 2015 and 2012 (tables 15A.40 and 15A.43).
Nationally, the proportion of primary carers who were satisfied with the quality of services received was 66.6 per cent in 2018 compared to 73.4 per cent in 2015 and 69.0 per cent in 2012 (figure 15.5; table 15A.42). There was no significant change from 2015 in satisfaction with the range of services received (29.6 per cent in 2018, 32.5 per cent in 2015 and 33.7 per cent in 2012) (figure 15.5; table 15A.44).
7. Service quality and safety
‘Service quality and safety’ is an indicator of governments’ objective to provide access to disability services that meet a particular standard of safety and quality; and under the NDIS, to promote the provision of high quality and innovative supports.
‘Service quality and safety' refers to the right of individuals to receive safe and high quality disability services, free from abuse and neglect.
Higher levels of service quality and safety are desirable.
Measures for this indicator are under development.
8. Government contribution per user of non‑government provided services
‘Government contribution per user of non‑government provided services’ is an indicator of governments’ objective to provide access to disability services in an efficient manner.
‘Government contribution per user of non‑government provided services’ is defined as the net Australian government expenditure divided by the number of users of non‑government provided employment services.
Given that most disability services previously provided by State and Territory governments have now transitioned to the NDIS, there are no efficiency measures to report for such services.
Assuming all other factors remain constant (such as service quality and accessibility), low or decreasing government expenditure per service user reflects a more efficient provision of this service.
Efficiency data are difficult to interpret. Although high or increasing expenditure per unit of output can reflect deteriorating efficiency, it can also reflect improvements in the quality or other attributes of the services provided, or an increase in the service needs of users. Similarly, low or declining expenditure per unit of output can reflect improving efficiency, or lower quality and less effective services.
Nationally, for all employment services, the estimated Australian Government contribution per service user assisted (non‑government provided employment services) was $3385 in 2020‑21 (figure 15.6) — $3356 per user of open services (employed or seeking employment in the open labour market) and $12 505 per user of supported services (employed by the service provider) (table 15A.45). The 2020-21 figure was 20 per cent lower than for 2019-20 (which was $4246 per user assisted) due to changes in the mix of users and funding across open and supported employment programs (table 15A.45).
8a. Interpreting efficiency data
This Report includes 2020‑21 expenditure data provided by Australian, State and Territory governments. Expenditure data in this Report may differ from information reported elsewhere (for example, data in this Report exclude users of specialist psychiatric disability services only). Information on differences in expenditure can be found in table 15.3.
| NSW | Vic | Qld | WA | SA | Tas | ACT | NT | Aus Gov | ||
|---|---|---|---|---|---|---|---|---|---|---|
| Superannuation | Included |  | | | | | | | | |
| Basis of estimate | Accrual | Accrual | Accrual | Accrual | Accrual | Accrual | Accrual | Accrual | Accrual | |
| Workers compensation | Included | | | | | | | | | |
| Actual payroll tax | Included |  | |  | | | | | | |
| Basis of apportioning umbrella department costs | Included | | | | | | | | | |
| Departmental formula | | | | | | | | | | |
| % of FTE employees | | | | | | | | | | |
| Long service leave | Entitlements | | | | | | | | | |
| Basis of estimate | Accrual | Accrual | Accrual | Accrual | Accrual | Accrual | Accrual | Accrual | Accrual | |
| Depreciation | | | | | | | | | |
FTE = full time equivalent. Not applicable. Not included. Included.
Source: Australian, State and Territory governments unpublished.
9. Labour force participation and employment of people with disability
‘Labour force participation and employment of people with disability’ is an indicator of governments’ objective to help people with disability achieve economic participation.
‘Labour force participation and employment of people with disability’ is defined by three measures (each by disability status):
- Labour force participation rate defined as the number of people with disability aged 15–64 years who are in the labour force (employed or unemployed) divided by the number of people with disability aged 15–64 years
- Employment–to–population ratio defined as the number of people with disability aged 15–64 years who are employed divided by the number of people with disability aged 15–64 years
- Unemployment rate defined as the number of people with disability aged 15–64 years who are unemployed divided by the number of people with disability aged 15–64 years who are in the labour force (employed or unemployed).
High or increasing labour force participation and employment rates and low or decreasing unemployment rates for people with disability are desirable.
This indicator does not specify whether the employment positions are appropriate or fulfilling. Data on underemployment (see the 'Key terms and references' tab for definition) can be found in table 15A.47.
For people aged 15–64 years with a profound or severe core activity limitation, 27.2 per cent were in the labour force and 23.9 per cent were employed in 2018; these rates are similar to 2015 but lower than 2009 (figure 15.7; tables 15A.48–49). The unemployment rate was 12.7 per cent in 2018; not significantly different to previous survey years (table 15A.50).
10. Labour force participation of primary carers of people with disability
‘Labour force participation of primary carers of people with disability’ is an indicator of governments’ objective to help carers of people with disability achieve economic participation.
‘Labour force participation of primary carers of people with disability’ is defined by three measures:
- Labour force participation rate defined as the number of primary carers of people with disability aged 15–64 years who are in the labour force (employed or unemployed) divided by the number of primary carers of people with disability aged 15–64 years
- Employment–to–population ratio defined as the number of primary carers of people with disability aged 15–64 years who are employed divided by the number of primary carers of people with disability aged 15–64 years
- Unemployment rate defined as the number of primary carers of people with disability aged 15–64 years who are unemployed divided by the number of primary carers of people with disability aged 15–64 years who are in the labour force (employed or unemployed).
High or increasing labour force participation and employment rates and low or decreasing unemployment rates for carers of people with disability are desirable.
This indicator does not provide information on whether the participation in the labour force is fulfilling. Information on the rate of underemployment can be found in table 15A.53 (see the 'Key terms and references' tab for definition).
Nationally in 2018, the labour force participation rate and employment–to–population ratio for primary carers of people with disability aged 15–64 years was 57.0 per cent and 53.2 per cent respectively; these rates are not significantly different from 2015 and 2012 (figure 15.8; tables 15A.54–55).
Nationally, the unemployment rate for primary carers of people with disability aged 15–64 years did not change significantly between 2012 and 2018, with the rate at 7.1 per cent in 2018 (table 15A.56).
‘Social participation of people with disability’ is an indicator of governments’ objective to help people with disability achieve social participation.
‘Social participation of people with disability’ is defined by three measures:
- The proportion of people with disability aged 15–64 years who have had face‑to‑face contact with ex‑household family or friends in the previous week
- The proportion of people with disability aged 15–64 years who travelled to a social activity in the last two weeks
- The proportion of people with disability aged 5–64 years who report the main reason for not leaving home as often as they would like is their disability or condition.
A high or increasing proportion of people with disability who participate in social or community activities reflects greater inclusion in the community.
This indicator does not provide information on the degree to which the identified types of social or community activities contribute to people’s quality of life.
Social participation outcomes decreased from 2009 to 2018.
- Nationally, for people with disability aged 15–64 years, the proportion who had face‑to‑face contact with ex‑household family or friends in the previous week decreased by around 9 percentage points to 67.6 per cent (table 15A.60).
- The decrease was less for the proportion who travelled to a social activity in the last two weeks (down by 4 percentage points to 89.7 per cent; figure15.9). Though for people with a severe or profound disability the decrease was greater (down by around 8 percentage points to 79.7 per cent; table 15A.61).
- Nationally, for people with disability aged 5–64 years, the proportion who reported the main reason for not leaving home as often as they would like is their disability or condition increased from 12.7 per cent in 2009 to 16.3 per cent in 2018 (table 15A.62). For those with severe or profound disability, the proportion was stable over this period, and was 30.9 per cent in 2018 (table 15A.65).
12. Use of mainstream services by people with disability
‘Use of mainstream services by people with disability’ is an indicator of governments’ objective that people with disability and their carers have an enhanced quality of life and enjoy choice and wellbeing.
‘Use of mainstream services by people with disability’ is defined as the proportion of people with disability who sought to access mainstream services and were able to do so confidently (that is without experiencing difficulty or discrimination). Data are reported for the following proxy measures:
- the proportion of people with disability aged 15–64 years (living in households) who experienced discrimination due to disability from service and hospitality staff in the last 12 months
- the proportion of people with disability aged 15–64 years (living in households) who avoided services due to disability in the last 12 months
- the proportion of people with disability aged 15–64 years (living in households) who could not use or use only some public transport.
Data for possible sources of discrimination include: teacher or lecturer; health staff; bus driver, rail staff or taxi driver; restaurant and hospitality staff; and sales staff. Data for possible services avoided due to discrimination include: education and medical facilities; shops, banks and other services; restaurants, cafes or bars; public transport; parks and other recreation facilities.
Low or decreasing proportions of people with disability experiencing difficulty or discrimination is desirable.
Contextual information on the proportion of active National Disability Insurance Scheme (NDIS) participants with approved plans accessing mainstream supports is available in table 15A.72.
Nationally in 2018, for people with disability aged 15–64 years:
- 5.6 per cent reported experiencing unfair treatment or discrimination in the last 12 months from service and hospitality staff, due to their disability. (The proportion was higher for those outside of major cities (7.0 per cent) compared to those within (4.8 per cent) (figure 15.10; table 15A.68).)
- around one‑quarter (27.7 per cent) avoided services that involved interaction with service and hospitality staff, due to their disability (figure 15.10; table 15A.69)
- and 15.6 per cent reported they could not use, or could use only some, public transport (figure 15.10; table 15A.71).
13. Carer health and wellbeing
‘Carer health and wellbeing’ is an indicator of governments’ objective that people with disability and their carers have an enhanced quality of life and enjoy choice and wellbeing.
‘Carer health and wellbeing’ is defined using two measures:
- the proportion of primary carers of people with disability who feel satisfied with their caring role
- the proportion of primary carers of people with disability who do not experience negative impacts on their wellbeing due to their caring role.
A high or increasing rate of carers who feel satisfied with their caring role and who do not experience negative impacts on their wellbeing due to their caring role is desirable.
Nationally in 2018, 22.1 per cent of primary carers of people with disability were satisfied with their caring role and 43.7 per cent did not experience negative impacts on their wellbeing due to their caring role (figure 15.11). Rates of satisfaction and not experiencing negative impacts were higher for male carers compared to female carers (figure 15.11; tables 15A.15–16).
Performance indicator data for Aboriginal and Torres Strait Islander people in this section are available in the data tables listed below. Further supporting information can be found in the 'Indicator results' tab and data tables.
| Table number | Table title |
|---|---|
| Table 15A.19 | Proportion of the potential population who are participants in the NDIS, by Indigenous status |
| Table 15A.20 | Users of Employment Support Services aged 15–64 years, by Indigenous status |
| Table 15A.21 | Aboriginal and Torres Strait Islander users of Employment Support Services aged 15-64 years, by age |
| Table 15A.22 | Aboriginal and Torres Strait Islander users of Disability Management Services aged 15-64 years, by age |
| Table 15A.34 | Rate of younger people admitted to permanent residential aged care per 10 000 potential population, by Indigenous status, by age |
| Table 15A.36 | Younger people who separated from permanent residential aged care to return to home/family, by Indigenous status, by age |
| Table 15A.37 | Younger people receiving permanent residential aged care, by Indigenous status, by age |
Key terms
| Term | Definition |
|---|---|
Core activities as per the 2018 ABS SDAC | Communication, mobility and self‑care. |
Disability | The United Nation’s Convention on the Rights of Persons with Disabilities, ratified by Australia on 17 July 2008, defines ‘persons with disabilities’ as those who have long term physical, mental, intellectual or sensory impairments which in interaction with various barriers may hinder their full and effective participation in society on an equal basis with others. The World Health Organisation defines ‘disabilities’ as impairments, activity limitations, and participation restrictions: an impairment is a problem in body function or structure; an activity limitation is a difficulty encountered by an individual in executing a task or action; and a participation restriction is a problem experienced by an individual in involvement in life situations. Disability is a complex phenomenon, reflecting an interaction between features of a person’s body and features of the society in which he or she lives (WHO 2009). In the ABS SDAC 2018, a person has a disability if they ‘report they have a limitation, restriction or impairment, which has lasted, or is likely to last, for at least six months and restricts everyday activities. This includes:
The third Commonwealth State/Territory Disability Agreement (CSTDA) (2003, p. 9) defined ‘people with disabilities’ as those whose disability manifests itself before the age of 65 years and for which they require significant ongoing and/or long term episodic support. For these people, the disability will be attributable to an intellectual, psychiatric, sensory, physical or neurological impairment or acquired brain injury (or some combination of these) which is likely to be permanent and results in substantially reduced capacity in at least one of the following: self‑care/management, mobility and communication. |
Employment services | Employment services comprise open employment services and supported employment services. Where users of employment services are described without further qualification, this includes people who use either or both open and supported employment services. All open employment services are now included in the Disability Employment Services (DES) program administered by the Department of Social Services (DSS). Disability Employment Services has two parts: Disability Management Services (DMS) is for job seekers with disability, injury or health condition who need assistance to find a job and occasional support to keep a job; and Employment Support Services (ESS) provides assistance to people with permanent disability and who need regular, ongoing support to keep a job. |
Geographic location | Geographic location is based on the Australian Statistical Geography Standard of Remoteness Areas, which categorises areas as ‘major cities’, ‘inner regional’, ‘outer regional’, ‘remote’, ‘very remote’ and ‘migratory’. The criteria for Remoteness Areas are based on the Accessibility/Remoteness Index of Australia, which measures the remoteness of a point based on the physical road distance to the nearest urban centre in each of five size classes (ABS 2011b). The ‘outer regional and remote/very remote’ classification used in this Report was derived by adding outer regional, remote and very remote data. |
Government and non‑government provided services | Government provision means that a service is both funded and directly provided by a government department, agency or local government. Non‑government provision is a service purchased or part‑funded by a government department or agency, but provided by a non‑government organisation. Non‑government service providers may receive funds from the private sector and the general public in addition to funding, grants and input tax concessions (such as payroll tax exemptions) from governments. Data on funds that non‑government service providers receive from the private sector and the general public are outside the scope of this Report. |
Informal carer | ABS informal assistance/providers: unpaid help or supervision that is provided to persons with disability or persons aged 65 years and over. It only includes assistance that is provided because of a person’s disability or because they are older. Informal assistance may be provided by family, friends, or neighbours. For the Survey of Disability, Ageing and Carers, any assistance received from family or friends is considered to be informal regardless of whether or not the provider was paid, such as through the Carer Payment or other allowances. It does not include providers whose care is privately organised (ABS 2019). Section 5 of the Carer Recognition Act (Cwlth) 2010 defines the term ‘carer’ for the purposes applying to that legislation. See also primary carer. |
Labour force participation rate for people with a profound or severe core activity limitation | The total number of people with a profound or severe core activity limitation in the labour force (where the labour force includes employed and unemployed people), divided by the total number of people with a profound or severe core activity limitation who are aged 15–64 years, multiplied by 100. An employed person is a person who, in his or her main job during the remuneration period (reference week):
An unemployed person is a person aged 15–64 years who was not employed during the remuneration period, but was looking for work. |
Mild core activity limitation | The person needs no help and has no difficulty with any of the core activity tasks, but:
|
Moderate core activity limitation | The person needs no help, but has difficulty with a core activity task (as per the 2018 SDAC). |
NDA potential population | The ‘potential population’ is the number of people with the potential to require disability support services, including individuals who meet the service eligibility criteria but who do not demand the services. The potential population is the number of people aged 0–64 years (and Aboriginal and Torres Strait Islander people aged 0–49 years) who are most appropriately supported by disability services, require ongoing and/or long term episodic support, have a permanent or chronic impairment, and who have a substantially reduced capacity in one or more core activities. For supported employment services, only the potential population aged 15–64 years participating in the labour force are included. For open employment services, the potential population is not used; instead, an estimate of all people with a disability and an employment restriction aged 15–64 is used. Where combined employment services denominators or rates are presented, the supported employment potential population is used. Potential populations have been estimated for each of the special needs groups (outer regional and remote/very remote areas, Aboriginal and Torres Strait Islander people and people born in a non‑English speaking country) and for those outside of the special needs groups (major cities and inner regional areas, non‑Indigenous and people born in an English speaking country). As Aboriginal and Torres Strait Islander people have significantly higher disability prevalence rates and greater representation in some NDA specialist disability services than non‑Indigenous people, and there are differences in the share of different jurisdictions’ populations who are Aboriginal and Torres Strait Islander, a further Aboriginal and Torres Strait Islander factor adjustment was undertaken. The Aboriginal and Torres Strait Islander factor was multiplied by the ‘expected current population estimate’ of people in the potential population in each jurisdiction to derive the ‘potential population’. The potential populations for 2005‑06 to 2006‑07 were calculated using national age and sex specific rates of severe or profound core activity limitation from the ABS Survey of Disability, Ageing and Carers (SDAC) conducted in 2003. In 2011, the 2009 SDAC was released, and recalculation of the potential population has resulted in a break in series between the 2003 and 2009 surveys. In 2014, the 2012 SDAC was released, and recalculation of the potential population has resulted in a break in series between the 2009 and 2012 surveys. In 2016, the 2015 SDAC was released, and recalculation of the potential population has resulted in a break in series between the 2012 and 2015 surveys. Data measuring the potential population is not available for each reported year and so has been estimated from several sources based on the following assumptions:
For more information on the method of calculation of the potential population, see appendix A of SCRGSP (2013). |
NDIS potential population | This population includes those with significant and enduring support needs who are eligible for individualised support under the NDIS. It is derived by the NDIA, based on the method used in the Productivity Commission report Disability Care and Support , released in 2011. To estimate the number of people with significant and enduring support needs who would be eligible for individualised support, in Disability Care and Support the Productivity Commission:
Using data from the 2009 SDAC, the Commission estimated that just over 410 000 persons would be eligible for support under the NDIS in 2009. On at least an annual basis, the emerging experience of the NDIS is compared to the initial estimates of the Productivity Commission, to determine whether an adjustment to the potential population is necessary. In 2018, the NDIA further developed experience‑based modelling for this purpose. ABS population growth rates are then used to arrive at the total potential population at a point in time (for example, total potential population as at 30 June 2020). For special needs groups, the NDIA uses ABS Census to obtain information on the number of individuals with ‘need for assistance’, which is available by CALD and Indigenous status, and also allows for regional variation. The total potential population is then allocated by LGA, sex, Indigenous and CALD status using the ‘need for assistance’ variable distribution. In the 2020 Annual Financial Sustainability Report, the NDIA projected a higher future steady state potential population for the NDIS than previous estimates, resulting in a significant increase in the estimated NDIS potential population between June 2020 and June 2021. |
Payroll tax | A tax levied on employers based on the value of wages and certain supplements paid or payable to, or on behalf of, their employees (SCRCSSP 1999). Payroll tax arrangements for government funded and delivered services differ across jurisdictions. Differences in the treatment of payroll tax can affect the comparability of unit costs across jurisdictions and services. These differences include payroll tax exemptions, marginal tax rates, tax free thresholds and clawback arrangements (see SCRCSSP 1999). There are two forms of payroll tax reported: actual — payroll tax actually paid by non‑exempt services imputed — a hypothetical payroll tax amount estimated for exempt services. A jurisdiction’s estimate is based on the cost of salaries and salary related expenses, the payroll tax threshold and the tax rate. |
Primary carer | ABS SDAC primary carer: A primary carer is a person who provides the most informal assistance to a person with one or more disabilities, with one or more of the core activities of mobility, self‑care, or communication. (ABS 2019). See also informal carer. |
Primary disability group | Disability group that most clearly expresses the experience of disability by a person. The primary disability group can also be considered as the disability group causing the most difficulty to the person (overall difficulty in daily life, not just within the context of the support offered by a particular service). |
Profound core activity limitation | The person is unable to do, or always needs help with, a core activity task. (as per the 2018 SDAC). |
Real expenditure | Actual expenditure (accrual) adjusted for changes in prices, using the General Government Final Consumption Expenditure (GGFCE) deflator, and expressed in terms of current year dollars. |
Schooling or employment restriction | Schooling restriction: as a result of disability, being Unable to attend school, attends a special school, attends special classes at an ordinary school, needs at least one day a week off school on average, has difficulty at school. Employment restriction: as a result of disability, permanently unable to work, restricted in the type of work they can or could do, need, or would need, at least one day a week off work on average, restricted in the number of hours they can, or could, work, requires special equipment, modified work environment or special arrangements, needs ongoing assistance or supervision, would find it difficult to change jobs or get a preferred job, needs assistance from a disability job placement program or agency. |
Service | A service is a support activity provided to a service user, in accord with the NDA. Services within the scope of the collection are those for which funding has been provided during the specified period by a government organisation operating under the NDA. |
Service user | A service user is a person with disability who receives a specialist disability service. A service user may receive more than one service over a period of time or on a single day. |
Severe core activity limitation | The person sometimes needs help with a core activity task, and/or has difficulty understanding or being understood by family or friends, or can communicate more easily using sign language or other non‑spoken forms of communication. (as per the SDAC 2018). |
Underemployment | Underemployed people are defined as persons with disability aged 15–64 years who are employed and usually work less than 35 hours per week, who wanted to work more hours and would be able to start work with more hours in the next 4 weeks. |
References
ABS (Australian Bureau of Statistics) 2011a, Disability, Ageing and Carers Australia: Summary of Findings 2009, Cat. no. 4430.0, Canberra.
—— 2011b, Australian Statistical Geography Standard (ASGS): Volume 5 ‑ Remoteness Structure, Cat. no. 1270.0.55.005, Canberra.
—— 2013, Disability, Ageing and Carers Australia: Summary of Findings 2012, Cat. no. 4430.0, Canberra.
—— 2016, Disability, Ageing and Carers Australia: Summary of Findings 2015, Cat. no. 4430.0, Canberra.
—— 2019, Disability, Ageing and Carers Australia: Summary of Findings 2018, Cat. no. 4430.0, Canberra.
—— 2021, Characteristics of National Disability Insurance Scheme (NDIS) participants, 2019: Analysis of linked data, https://www.abs.gov.au/articles/characteristics-national-disability-insurance-scheme-ndis-participants-2019-analysis-linked-data (accessed 4 October 2021).
AIHW (Australian Institute of Health and Welfare) 2007, Disability Support Services 2005‑06: National Data on Services Provided under the CSTDA/NDA, Cat. no. DIS 51, Canberra.
—— 2012, Disability support services 2010‑11: Services provided under the National Disability Agreement, DIS 60. Canberra.
—— 2020, Disability support services: Services provided under the National Disability Agreement 2018‑9 https://www.aihw.gov.au/reports/disability-services/disability-support-services-services-nda-18-19/contents/summary (accessed 17 August 2020).
CSTDA (Commonwealth State/Territory Disability Agreement) 2003, Agreement between the Commonwealth of Australia and the States and Territories of Australia in Relation to Disability Services, Australian Government Department of Family and Community Services, Canberra.
COAG (Council of Australian Governments) 2012, National Disability Agreement, https://www.federalfinancialrelations.gov.au/content/npa/national_agreements/national-disability-agreement.rtf (accessed 8 December 2017).
DSS (Department of Social Services) 2021, Department of Social Services 2020‑21 Annual Report, Commonwealth of Australia, Canberra.
NDIA (National Disability Insurance Agency) 2019, Continuity of Support, https://www.ndis.gov.au/applying-access-ndis/people-receiving-supports-other-governments/continuity-support (accessed 12 November 2020).
—— 2020, Governance,https://www.ndis.gov.au/about-us/governance (accessed 12 November 2020).
—— 2021a, Quarterly Report to COAG Disability Reform Council, 30 June 2021 https://www.ndis.gov.au/about-us/publications-and-reports/quarterly-reports.html (accessed 4 October 2021).
—— 2021b, Support for Decision Making consultation, https://www.ndis.gov.au/community/have-your-say/support-decision-making-consultation?utm_source=National+Disability+Insurance+Scheme+eNewsletter&utm_campaign=752f641214-EMAIL_CAMPAIGN_2017_01_20_COPY_01&utm_medium=email&utm_term=0_85b9cee0c8-752f641214-20464981 (accessed 4 October 2021).
NDIS Quality and Safeguards Commission 2020, Activity Report 1 July 2019 to 30 June 2020, https://www.ndiscommission.gov.au/sites/default/files/documents/2020-09/activit-report-jul19-jun20.pdf (accessed 15 October 2020).
NDS (National Disability Services) 2018, Australian Disability Workforce Report, 3rd edition, July.
SCRCSSP (Steering Committee for the Review of Commonwealth/State Service Provision) 1999, Payroll Tax in the Costing of Government Services, AusInfo, Canberra.
SCRGSP (Steering Committee for the Review of Government Service Provision) 2013, National Agreement performance information 2012‑13 — National Disability Agreement, Productivity Commission, Canberra.
WHO (World Health Organization) 2009, Disabilities, Health topics, Geneva, https://www.who.int/topics/disabilities/en/ (accessed 13 October 2009).
Download supporting material
- 15 Services for people with disability data tables (XLSX - 813 Kb)
- 15 Services for people with disability (CSV - 2121 Kb)
See the corresponding table number in the data tables for detailed definitions, caveats, footnotes and data source(s).
11. Social participation of people with disability