Report on Government Services 2020
Part C, Section 8: released on 29 January 2020
8 Corrective services
This section is presented in a new online format. Dynamic data visualisations replace the static chapter format used in previous editions. Machine readable data are also available for download. A guide is available on accessing information in the new format.
This section reports on prison custody and a range of community corrections orders and programs for adult offenders which are delivered separately by the eight states and territories.
The Indicator Results tab uses data from the data tables to provide information on the performance for each indicator in the Indicator Framework. The same data in the data tables are also available in CSV format.
Skip to downloadable Corrective services data tables and supporting material
- Context
- Indicator Framework
- Indicator Results
- Indigenous Data
Objectives for corrective services
Corrective services aim to contribute to the protection and creation of safer communities through the effective management of offenders and prisoners, commensurate with their needs and the risks they pose to the community, by providing:
- a safe, secure and humane custodial environment
- appropriate management of community corrections orders
- programs and services that address the causes of offending, maximise the chances of successful reintegration into the community, and encourage offenders to adopt a law abiding way of life.
Governments aim for corrective services to meet these objectives in an equitable and efficient manner.
Service overview
The operation of corrective services is significantly influenced by, and in turn influences, other components of the criminal justice system such as police services and courts. The management of prisoners and of offenders serving community corrections orders is the core business of all corrective services agencies. However, the legislative frameworks governing and impacting on corrective services, for example sentencing acts, vary widely. The scope of the responsibilities of these agencies also varies, for example, functions administered by corrective services in one jurisdiction may be administered by a different justice sector agency in another, such as the management of prisoners held in court cells.
This section reports on the performance of corrective services, which include prison custody and a range of community corrections orders and programs for adult offenders1 (for example, parole and community work orders). Both public and privately operated correctional facilities are included; however, the scope of this section generally does not extend to:
- youth justice (reported on in section 17, Youth justice services)
- prisoners or alleged offenders held in forensic mental health facilities to receive psychiatric care (who are usually the responsibility of health departments)
- prisoners held in police custody (reported on in section 6, Police services)
- people held in facilities such as immigration detention centres.
1. Adult offenders in prison and community corrections are aged 18 years and over in all Australian states and territories with the exception of Queensland. In February 2018, the Youth Justice and Other Legislation (Inclusion of 17-year-old Persons) Amendment Act 2016 commenced in Queensland, increasing the age that a person can be charged as an adult from 17 to 18 years, bringing Queensland legislation in line with all other Australian jurisdictions. Transitional provisions mean that 17‑year‑olds are being gradually transferred from adult community corrections and prisons to youth justice supervision. For 2018-19, adult corrections data may still include 17‑year‑olds in Queensland, but the numbers involved are relatively small and will have a minimal impact on reported rates during this period.
Roles and responsibilities
Corrective services are the responsibility of State and Territory governments, which may deliver services directly, purchase them through contractual arrangements or operate a combination of both arrangements. All jurisdictions maintained government operated prison facilities during the reporting period while private prisons operated in five jurisdictions (NSW, Victoria, Queensland, WA and SA). No jurisdiction operated periodic detention in 2018-19.
Community corrections is responsible for administering a range of non-custodial sanctions and also manages prisoners who are released into the community and continue to be subject to corrective services supervision. These services vary in the extent and nature of supervision, the conditions of the order (such as a community work component or a requirement to attend an offender program) and the level of restriction placed on the offender’s freedom of movement in the community (for example, home detention).
No single objective or set of characteristics is common to all jurisdictions’ community corrections services, other than that they generally provide a non-custodial sentencing alternative or a post-custodial mechanism for reintegrating prisoners into the community under continued supervision. In some jurisdictions, community corrections responsibility includes managing offenders on supervised bail orders. Table 8.1 shows the range of sanctions involving corrective services that operated in each jurisdiction during the reporting period.
Funding
Nationally in 2018-19, expenditure (net of revenues) on corrective services was $3.64 billion for prisons and $0.71 billion for community corrections2 (table 8A.1). Expenditure plus depreciation (matching expenditure reporting by other justice sector agencies) was almost $4.77 billion – a real increase of 5.8 per cent from 2017-18 (table 8A.2). Changes in expenditure need to be considered in the context of the growth in corrective services populations over time.
2.This expenditure is net of operating revenues and excludes capital costs (depreciation, user cost of capital and debt service fees), payroll tax, and expenditure on transport/escort services and prisoner health. Some jurisdictions are unable to fully disaggregate transport costs and/or health expenditure from other prison operating costs. See table 8A.1 for detailed definitions, footnotes and caveats.
Size and scope
Prison custody
Corrective services operated 119 custodial facilities nationally at 30 June 2019, comprising 93 government operated prisons, 10 privately operated prisons, four transitional centres, and twelve 24-hour court cell complexes (holding prisoners under the responsibility of corrective services in NSW) (table 8A.3).
On average, 43 115 people per day were held in Australian prisons during 2018-19 (table 8A.4), of which 81.1 per cent were held in secure facilities. A daily average of 8549 prisoners (19.8 per cent of the prisoner population), were held in privately operated facilities during the year (table 8A.4). Nationally, females represented 8.3 per cent of the daily average prison population, and Aboriginal and Torres Strait Islander prisoners represented 27.8 per cent of the daily average population.
In 2018-19, the national imprisonment rate was 220.2 per 100 000 people in the relevant adult population (figure 8.1). This represents an increase of 28.4 per cent since 2009-10 (table 8A.5). The rate for males (411.0 per 100 000 males) was over 11 times the rate for females (36.1 per 100 000 females) (table 8A.5).
The national crude imprisonment rate per 100 000 Aboriginal and Torres Strait Islander population was 2359.5 in 2018-19 compared with a rate of 161.3 for the non-Indigenous population (table 8A.5). Comparisons of imprisonment rates should be made with care, especially for states and territories with relatively small Aboriginal and Torres Strait Islander populations. Small changes in prisoner numbers can cause variations in rates that do not accurately represent either real trends over time or consistent differences from other jurisdictions.
The Aboriginal and Torres Strait Islander population has a younger age profile compared with the non-Indigenous population, which contributes to higher crude imprisonment rates. After adjusting for differences in population age structures, the national age standardised imprisonment rate per 100 000 Aboriginal and Torres Strait Islander population in 2018-19 was 1911.0, compared with a corresponding rate of 170.4 for the non-Indigenous population (figure 8.2). Therefore, after taking into account the effect of differences in the age profiles between the two populations, the national imprisonment rate for the Aboriginal and Torres Strait Islander population is 11 times greater than for the non-Indigenous population. Rates that do not take age profile differences into account are almost 15 times greater.
While imprisonment rates for the Aboriginal and Torres Strait Islander population, whether calculated on a crude or age standardised basis, are higher than those for the non‑Indigenous population, the majority of prisoners are non‑Indigenous. Ten-year trends in daily average numbers and rates for Aboriginal and Torres Strait Islander and non‑Indigenous prisoners are reported in table 8A.6.
Community corrections
Nationally, on a daily average, there were 15.6 offenders for every one (full time equivalent) community corrections staff member in 2018‑19 (table 8A.7). Nationally, an average of 75 235 offenders per day were serving community corrections orders in 2018-19 (table 8A.8), with females representing 19.3 per cent of the offender population (higher than the proportion in the prison population), and Aboriginal and Torres Strait Islander offenders representing 21.2 per cent of the offender population (lower than the proportion in the prison population).
In 2018-19, the national crude community corrections rate was 384.2 per 100 000 relevant adult population. This is higher than the rate of 340.6 in 2009-10 (figure 8.3). The rate for female offenders was 145.4 compared with 631.5 for male offenders (table 8A.5).
The national crude rate for the Aboriginal and Torres Strait Islander population was 3144.0 offenders per 100 000 relevant adult population, compared with 302.7 for the non-Indigenous population (table 8A.5). After adjusting for differences in population age structures, the rate per 100 000 Aboriginal and Torres Strait Islander population in 2018‑19 was 2515.4, compared with a rate of 305.5 for the non-Indigenous population (figure 8.4). Therefore, after taking into account the effect of differences in the age profiles between the two populations, the national Aboriginal and Torres Strait Islander community corrections rate is eight times greater than for the non-Indigenous population. Rates that do not take age profile differences into account are 10 times greater.
As with prisoners, comparisons should be made with care because small changes in offender numbers in jurisdictions with relatively small Aboriginal and Torres Strait Islander populations can cause variations in rates that do not accurately represent either real trends over time or consistent differences from other jurisdictions. Ten year trends are reported in table 8A.9.
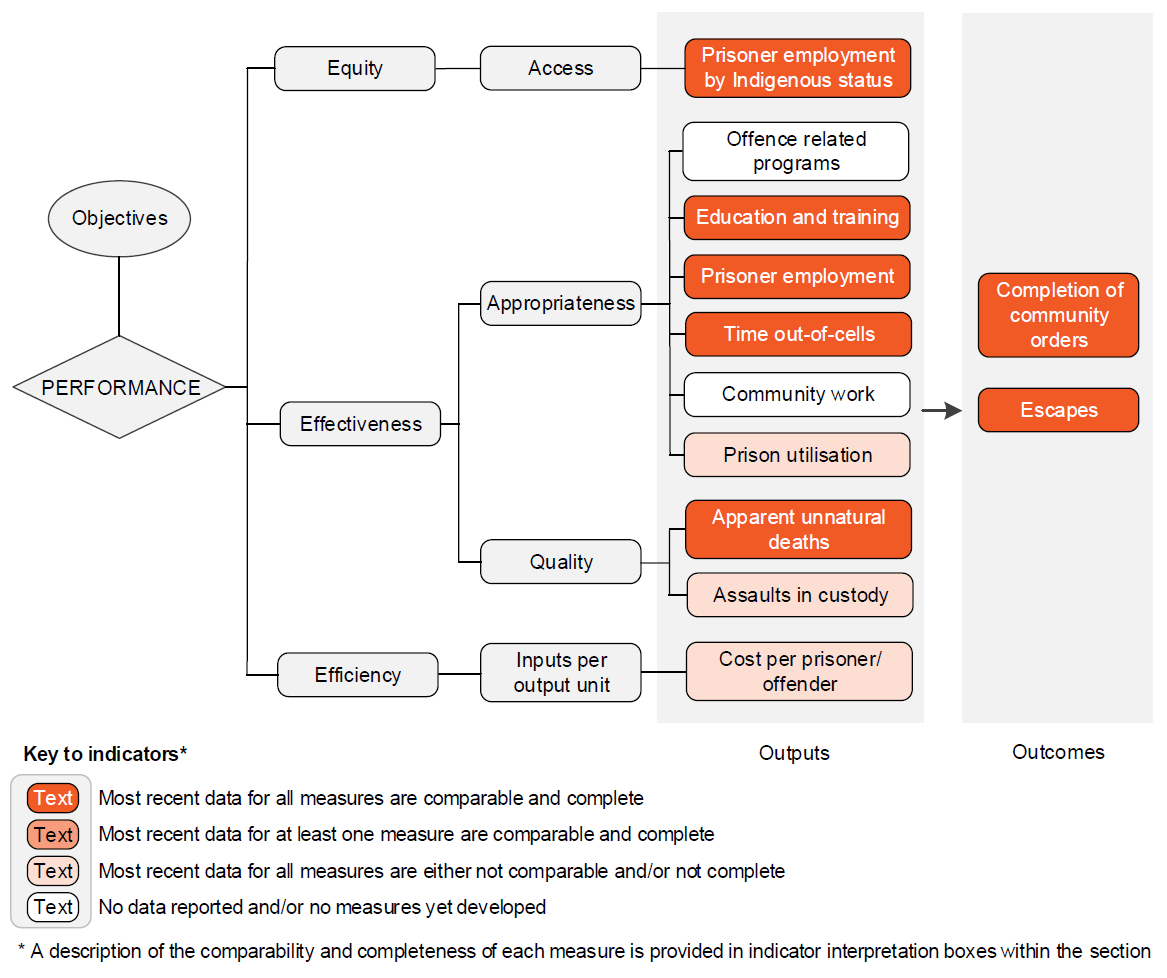
The performance indicator framework provides information on equity, efficiency and effectiveness, and distinguishes the outputs and outcomes of corrective services.
The performance indicator framework shows which data are complete and comparable in this Report. For data that are not considered directly comparable, text includes relevant caveats and supporting commentary. Section 1 discusses data comparability and completeness from a Report-wide perspective. In addition to the service area's Profile information, the Report’s statistical context (Section 2) contains data that may assist in interpreting the performance indicators presented in this section.
Improvements to performance reporting for corrective services are ongoing and will include identifying indicators to fill gaps in reporting against key objectives, improving the comparability and completeness of data and reviewing proxy indicators to see if more direct measures can be developed.
Outputs
Outputs are the actual services delivered (while outcomes are the impact of these services on the status of an individual or group) (see section 1). Output information is also critical for equitable, efficient and effective management of government services.
Outcomes
Outcomes are the impact of services on the status of an individual or group (see section 1).
An overview of the Corrective services performance indicator results are presented. Jurisdictional differences in service delivery settings, geographic dispersal and prisoner/offender population profiles have an impact on the effectiveness and efficiency of correctional service systems.
Information to assist the interpretation of these data can be found in the Corrective services interpretative material and data tables. The figures use data from the data tables. Data tables are identified by a ‘8A’ prefix (for example, table 8A.1).
All data are available for download as an excel spreadsheet and as a CSV dataset — refer to Download supporting material. Specific data used in figures can be downloaded by clicking in the figure area, navigating to the bottom of the visualisation to the grey toolbar, clicking on the 'Download' icon and selecting 'Data' from the menu. Selecting 'PDF' or 'Powerpoint' from the 'Download' menu will download a static view of the performance indicator results.
Performance indicator data for Aboriginal and Torres Strait Islander people in this section are available in the data tables listed below. Further supporting information can be found in the interpretative material and data tables.
| Table number | Table title |
|---|---|
| Table 8A.10 | Prisoner employment by Indigenous status |
| Table 8A.16 | Deaths from apparent unnatural causes by Indigenous status, number and rate per 100 Aboriginal and Torres Strait Islander/non-Indigenous prisoners |
| Table 8A.20 | Completion of community corrections orders (per cent) |
Download supporting material
- 8 Corrective services interpretative material (PDF - 243 Kb)
- 8 Corrective services interpretative material (Word - 51 Kb)
- 8 Corrective services data tables (XLSX - 165 Kb)
- 8 Corrective services dataset (CSV - 152 Kb)
See the interpretative material and corresponding table number in the data tables for detailed definitions, caveats, footnotes and data source(s).
Note: An errata was released with the Corrective services section reflecting updates to the presentation and files above.
Errata
The following data have changed for Section 8 Corrective services:
- Amended data for real net operating expenditure per prisoner for 2011-12 to 2016-17 for NSW, 2011-12 to 2015‑16 for ACT and 2011-12 to 2016-17 for Australian totals. Affects figure 8.10b and data table 8A.19.