Report on Government Services 2022
PART E, SECTION 11: RELEASED ON 1 FEBRUARY 2022
11 Ambulance services
Impact of COVID-19 on data for the Ambulance services section
COVID-19 may affect data in this Report in a number of ways. This includes in respect of actual performance (that is, the impact of COVID-19 on service delivery during 2020 and 2021 which is reflected in the data results), and the collection and processing of data (that is, the ability of data providers to undertake data collection and process results for inclusion in the Report).
For the Ambulance services section, there are no significant changes to the data as a result of COVID-19.
The focus of performance reporting in this section is on ambulance service organisations, which are the primary agencies involved in providing emergency medical care, pre-hospital and out-of-hospital care, and transport services.
The Indicator Results tab uses data from the data tables to provide information on the performance for each indicator in the Indicator Framework. The same data in the data tables are also available in CSV format.
- Context
- Indicator framework
- Indicator results
- Key terms and references
Objectives for ambulance services
Ambulance services aim to promote health and reduce the adverse effects of emergency events on the community. Governments’ involvement in ambulance services is aimed at providing emergency medical care, pre-hospital and out-of-hospital care, and transport services that are:
- accessible and timely
- meet patients' needs through delivery of appropriate health care
- high quality — safe, co-ordinated and responsive health care
- sustainable.
Governments aim for ambulance services to meet these objectives in an equitable and efficient manner.
Service overview
Ambulance services include preparing for, providing and enhancing:
- emergency and non-emergency pre-hospital and out-of-hospital patient care and transport
- inter-hospital patient transport including the movement of critical patients
- specialised rescue services
- the ambulance component of multi-casualty events
- the community’s capacity to respond to emergencies.
Roles and responsibilities
Ambulance service organisations are the primary agencies involved in providing services for ambulance events. State and Territory governments provide ambulance services in most jurisdictions. In WA and the NT, St John Ambulance is under contract to the respective governments as the primary provider of ambulance services.
Across jurisdictions the role of ambulance service organisations serves as an integral part of the health system. The role of paramedics has expanded over the last decade to include the assessment and management of patients with minor illnesses and injuries to avoid transport to hospital.On 1 December 2018, paramedicine became a nationally regulated profession with paramedics joining the National Registration and Accreditation Scheme (Paramedics Australasia, 2021). From this date, paramedics must be registered with the Paramedicine Board of Australia and meet the Board’s registration standards in order to practise in Australia (Paramedicine Board of Australia, 2018).
Funding
Total expenditure on ambulance services was $4.4 billion in 2020-21 (table 11A.10), which was funded from a mix of revenue sources. Total revenue of ambulance service organisations was $4.4 billion in 2020-21, representing an annual average growth rate of 6.0 per cent since 2016-17 (table 11.1).
Jurisdictions have different funding models to provide resourcing to ambulance service organisations. Nationally in 2020-21, state and territory government grants and indirect government funding formed the greatest source of ambulance service organisations funding (75.7 per cent), followed by transport fees (from public hospitals, private citizens and insurance) (19.1 per cent), and subscriptions and other income (5.2 per cent) (table 11A.1).
Size and scope
Human resources
Nationally in 2020-21, for ambulance services reported in this section there were:
- 16 742 full time equivalent salaried personnel (81.6 per cent were ambulance operatives)
- 21 177 registered paramedics
- 7428 volunteer personnel (88.8 per cent were ambulance operatives)
- 6716 paramedic community first responders. Community first responders are trained volunteers that provide an emergency response (with no transport capacity) and first aid care before ambulance arrival (table 11A.8).
Demand for ambulance services
Nationally in 2020-21, there were:
- 4.1 million incidents reported to ambulance service organisations1 (158.7 incidents per 1000 people)
- 5.2 million responses where an ambulance was sent to an incident (202.2 responses per 1000 people). There can be multiple responses sent to a single incident. There can also be responses to incidents that do not have people requiring treatment and/or transport
- 1217 response locations (5065 first responder locations with an ambulance) and 4136 ambulance general transport and patient transport vehicles
- 3.5 million patients assessed, treated or transported by ambulance service organisations2 (137.7 patients per 1000 people) (figure 11.1)
- 71 air ambulance aircraft available. There are air ambulance (also called aero-medical) services in all jurisdictions, although arrangements vary across jurisdictions (table 11A.2).
Ambulance service organisations prioritise incidents as:
- emergency — immediate response under lights and sirens required (code 1)
- urgent — undelayed response required without lights and sirens (code 2)
- non-emergency — non-urgent response required (codes 3, 4)
- casualty room attendance.
Nationally in 2020-21, 37.7 per cent of the 4.1 million incidents ambulance service organisations attended were prioritised as emergency incidents, followed by 35.7 per cent prioritised as urgent and 26.7 per cent prioritised as non-emergency (table 11A.2).
- An incident is an event that resulted in a demand for ambulance services to respond. Locate Footnote 1 above
- Patients are counted by the number of episodes. Patients may be the subject of more than one episode per year. Locate Footnote 2 above
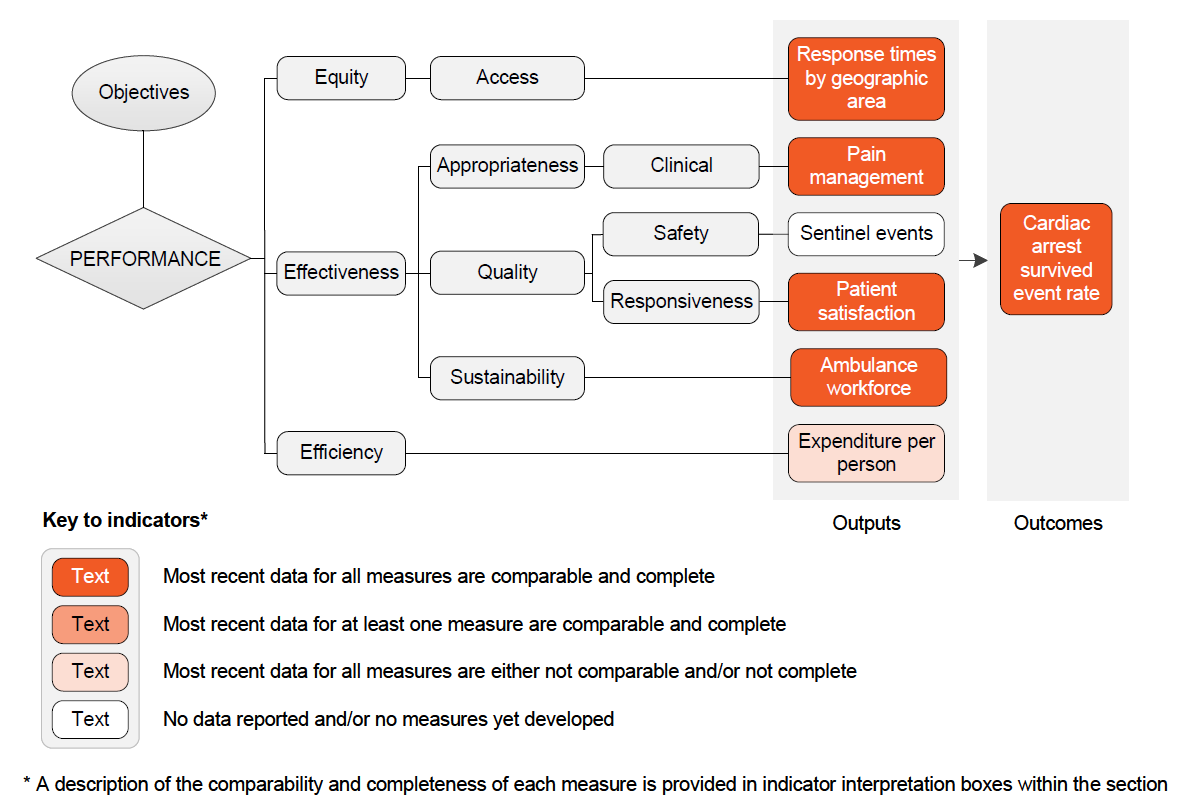
The performance indicator framework provides information on equity, efficiency and effectiveness, and distinguishes the outputs and outcomes of ambulance services.
The performance indicator framework shows which data are complete and comparable in this Report. For data that are not considered directly comparable, text includes relevant caveats and supporting commentary. Section 1 discusses data comparability and completeness from a Report-wide perspective. In addition to the contextual information for this service area (see Context tab), the Report’s statistical context (section 2) contains data that may assist in interpreting the performance indicators presented in this section.
Improvements to performance reporting for ambulance services are ongoing and include identifying data sources to fill gaps in reporting for performance indicators and measures, and improving the comparability and completeness of data.
Outputs
Outputs are the services delivered (while outcomes are the impact of these services on the status of an individual or group) (see section 1). Output information is also critical for equitable, efficient and effective management of government services.
Outcomes
Outcomes are the impact of services on the status of an individual or group (see section 1).
An overview of the Ambulance services indicator results is presented. Different delivery contexts, locations and types of clients can affect the equity, effectiveness and efficiency of ambulance services.
Information to assist the interpretation of these data can be found with the indicators below and all data (footnotes and data sources) are available for download from Download supporting material. Data tables are identified by a ‘11A’ prefix (for example, table 11A.1).
All data are available for download as an excel spreadsheet and as a CSV dataset — refer to Download supporting material. Specific data used in figures can be downloaded by clicking in the figure area, navigating to the bottom of the visualisation to the grey toolbar, clicking on the 'Download' icon and selecting 'Data' from the menu. Selecting 'PDF' or 'Powerpoint' from the 'Download' menu will download a static view of the performance indicator results.
1. Response times by geographic area
‘Response times by geographic area’ is an indicator of governments’ objective to provide ambulance services in an accessible manner.
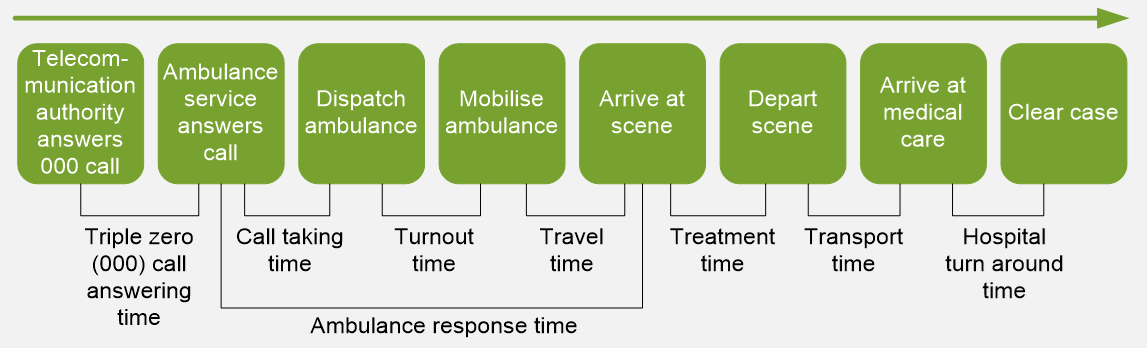
‘Response times by geographical area' is defined as the time taken between the initial receipt of the call for an emergency at the communications centre, and the arrival of the first responding ambulance resource at the scene of an emergency code 1 incident (illustrated below), by geographic area (capital city and state-wide), for the 50th and 90th percentile.
Capital city response times are currently measured by the response times within each jurisdiction's capital city — boundaries based on the ABS Greater Capital City Statistical Areas.
Response times are calculated for the 50th and 90th percentile — the time (in minutes) within which 50 per cent and 90 per cent of the first responding ambulance resources arrive at the scene of an emergency code 1 incident.
Many factors influence response times by geographic location including:
- land area
- population size and density
- dispersion of the population (particularly rural/urban population proportions), topography, road/transport infrastructure and traffic densities
- crew configurations, response systems and processes, and travel distances — for example, some jurisdictions include responses from volunteer stations (often in rural areas) where turnout times are generally longer because volunteers are on call as distinct from being on duty.
Short or decreasing response times suggest the adverse effects on patients and the community of emergencies requiring ambulance services are reduced. Similar response times across geographic areas indicate equity of access to ambulance services.
In 2020-21, the time within which 50 per cent of first responding ambulance resources arrived at the scene of an emergency in code 1 situations:
- in capital cities ranged from 9.0 to 13.8 minutes, increasing to between 14.7 to 34.4 minutes for 90 per cent to respond.
- state-wide ranged from 9.0 and 14.0 minutes, increasing to between 14.7 to 33.4 minutes for 90 per cent to respond (figure 11.2).
2. Pain management
‘Pain management’ is an indicator of governments’ objective to provide pre‑hospital and out‑of‑hospital care and patient transport services that meet patients’ needs through delivery of appropriate health care.
‘Pain management’ is defined as the proportion of patients who report a clinically meaningful reduction in pain severity. Clinically meaningful pain reduction is defined as a minimum 2-point reduction in pain score from first to final recorded measurement (based on a 1–10 numeric rating scale of pain intensity).
Includes patients who:
- are aged 16 years or over and received care from the ambulance service, which included the administration of pain medication (analgesia)
- recorded at least 2 pain scores (pre‑ and post‑treatment)
- recorded an initial pain score of 7 or above (referred to as severe pain).
Patients who refuse pain medication for whatever reason or have an unrecorded/missing date of birth are excluded.
A higher or increasing proportion of patients who report a clinically meaningful reduction in pain severity at the end of ambulance service treatment suggests appropriate care meeting patient needs.
Nationally in 2020-21, the proportion of patients who reported clinically meaningful pain reduction at the end of ambulance service treatment was 84.8 per cent. For most jurisdictions the proportion was above 80 per cent (figure 11.3).
3. Sentinel events
‘Sentinel events’ is an indicator of governments’ objective to deliver ambulance services that are high quality and safe.
‘Sentinel events’ is defined as the number of reported adverse events that occur because of ambulance services system and process deficiencies, and which result in the death of, or serious harm to, a patient.
Sentinel events occur relatively infrequently and are independent of a patient’s condition.
A low or decreasing number of sentinel events is desirable.
Data are not yet available for reporting against this indicator. The Council of Ambulance Authorities has completed a trial for a national data collection, but the results were not available for this Report.
4. Patient satisfaction
‘Patient satisfaction’ is an indicator of governments’ objective to provide emergency medical care, pre-hospital and out-of-hospital care, and transport services that are responsive to patients’ needs.
‘Patient satisfaction’ is defined as the quality of ambulance services, as perceived by the patient. It is measured as patient experience of aspects of response and treatment that are key factors in patient outcomes.
Patients are defined as people who were transported under an emergency event classified as code 1 (an emergency event requiring one or more immediate ambulance responses under lights and sirens where the incident is potentially life threatening) or code 2 (urgent incidents requiring an undelayed response by one or more ambulances without warning devices, with arrival desirable within 30 minutes).
The following measures of patient experience of ambulance services are reported:
- proportion of patients who felt that the length of time they waited to be connected to an ambulance service call taker was much quicker or a little quicker than they thought it would be
- proportion of patients who felt that the length of time they waited for an ambulance was much quicker or a little quicker than they thought it would be
- proportion of patients who felt that the level of care provided to them by paramedics was very good or good
- proportion of patients whose level of trust and confidence in paramedics and their ability to provide quality care and treatment was very high or high
- proportion of patients who were very satisfied or satisfied with the ambulance services they received in the previous 12 months.
High or increasing proportions can indicate improved responsiveness to patient needs.
Nationally in 2020-21, the majority of respondents (96.0 per cent) indicated they were satisfied or very satisfied with the ambulance services received in the previous 12 months (table 11.2).
After an increase nationally in 2019-20, the proportions of respondents in 2020-21 who indicated a quicker than expected wait time for call connection (62.0 per cent) and ambulance arrival (57.0 per cent) were the lowest of the 5 years of data reported (table 11.2).
5. Ambulance workforce
Sustainability is the capacity to provide infrastructure (that is, workforce, facilities, and equipment) into the future, be innovative and respond to emerging needs of the community.
‘Ambulance workforce’ is an indicator of governments’ objective to provide emergency medical care, pre-hospital and out-of-hospital care, and transport services that are sustainable.
‘Ambulance workforce’ is defined by two measures:
- ‘workforce by age group’ – the proportion of the operational salaried workforce in 10-year age groups (under 30, 30–39, 40–49, 50–59 and 60 and over)
- ‘operational workforce attrition’ – the proportion of full time equivalent salaried staff who exited the organisation. Includes staff in operational positions where paramedic qualifications are either essential or desirable to the role.
A low or decreasing proportion of the workforce who are in the younger age groups and/or a high or increasing proportion who are closer to retirement suggests sustainability problems may arise in the coming decade as the older age group starts to retire. Low or decreasing levels of staff attrition are desirable.
The workforce by age group and staff attrition measures should be considered together. Each provides a different aspect of the changing profile and sustainability of ambulance service organisations’ workforce and should also be considered in conjunction with data on the:
- number of students enrolled in accredited paramedic training courses (table 11A.9)
- availability of paramedics and response locations, which show that for some jurisdictions, there can be a large proportion of volunteers or volunteer ambulance locations (tables 11A.2 and 11A.8).
Nationally in 2020-21, the proportion of the ambulance workforce aged under 50 years was the lowest (76.4 per cent) of the last 10 years (the highest was 79.1 per cent in 2012-13) (figure 11.4 and table 11A.7). Supporting data on student enrolments in accredited paramedic training courses are available in table 11A.9, and shows that following a peak in 2019 the enrolment rate in 2020 was the lowest since 2013.
Nationally in 2020-21, the attrition rate was 2.9 per cent, an increase from 2.7 per cent in 2019-20, but a decrease from rates of between 3.3 and 4.6 per cent in all years prior to 2016-17 (tables 11.3 and 11A.7).
6. Expenditure per person
'Expenditure per person’ is a proxy indicator of governments’ objective to provide emergency medical care, pre-hospital and out-of-hospital care, and transport services in an efficient manner.
Expenditure per person’ is defined as total ambulance service organisation expenditure per person in the population.
All else being equal, lower expenditure per person represents greater efficiency. However, efficiency data should be interpreted with caution.
- High or increasing expenditure per person may reflect deteriorating efficiency. Alternatively, it may reflect changes in: aspects of the service (such as improved response); resourcing for first aid and community safety; or the characteristics of events requiring an ambulance service response, such as more serious medical presentations requiring complex clinical interventions.
- Differences in geographic size, terrain, climate, and population dispersal may affect costs of infrastructure and numbers of service delivery locations per person.
Nationally, total expenditure on ambulance service organisations was $171 per person in 2020-21, an increase of 2.5 per cent from the previous year (figure 11.5).
7. Cardiac arrest survived event rate
‘Cardiac arrest survived event rate’ is an indicator of governments’ objective to provide emergency medical care, pre-hospital and out-of-hospital care, and transport services that reduce the adverse effects of emergency events on the community.
‘Cardiac arrest survived event rate’ is defined as the proportion of adults patients (aged 16 years and over) who were in out‑of‑hospital cardiac arrest and had a returned to spontaneous circulation (that is, the patient having a pulse) on arrival at hospital.
Three measures are reported:
- Paramedic witnessed adult cardiac arrests where resuscitation attempted by ambulance or emergency medical services personnel.
- Non-paramedic witnessed adult cardiac arrests where non-paramedic resuscitation attempted.
- Non-paramedic witnessed adult Ventricular Fibrillation (VF) or Ventricular Tachycardia (VT) cardiac arrests3 where non-ambulance resuscitation attempted.
Cardiac arrests that are treated immediately by the paramedic have a better likelihood of survival due to immediate and rapid intervention. Patients who suffer a VF or VT cardiac arrest are more likely to have better outcomes compared with other causes of cardiac arrest as these conditions are primarily correctable through defibrillation.
This indicator reflects the survival rate to hospital and does not reflect the survival rate in or post-hospital. A high or increasing cardiac arrest survived event rate is desirable.
Nationally in 2020-21, the survival rates for patients in VF or VT cardiac arrest or paramedic witnessed cardiac arrest were higher than for non-paramedic witnessed cardiac arrest where resuscitation was attempted (figure 11.6).
- Ventricular Fibrillation (VF) is a heart rhythm problem that occurs when the heart beats with rapid, erratic electrical impulses. Ventricular Tachycardia (VT) is a type of regular and fast heart beat that arises from improper electrical activity in the ventricles of the heart. Locate Footnote 3 above
Key terms
| Terms | Definition |
|---|---|
Estimated resident population (ERP) | The official Australian Bureau of Statistics estimate of the Australian population. The ERP is derived from the 5-yearly Census counts and is updated quarterly between censuses. It is based on the usual residence of the person. |
Expenditure | Includes:
Excludes the user cost of capital for land, payroll tax and interest on borrowings. |
User cost of capital | The opportunity cost of funds tied up in the capital used to deliver services. Calculated as 8 per cent of the current value of non‑current physical assets (including land, plant and equipment). |
Human resources | Human resources refers to any person delivering a service, or managing the delivery of this service, including:
|
Revenue | Revenue received directly or indirectly by ambulance service organisations on an accrual accounting basis, including:
|
| Triple Zero (000) call answering time | The time interval commencing when the emergency telephone call first presents to and is acknowledged by the Emergency Service Organisation's (ESO) telephony system, to the time that the telephone call is answered by the ESO agent. This time interval is the product of any queueing time(s), internal or external routing/rerouting time(s), and the agent answer response time. |
| Volunteer personnel | Includes volunteer ambulance operatives and volunteer support staff. |
Volunteer ambulance operatives | All personnel engaged on an unpaid casual basis who are principally involved in the delivery of ambulance services, generally on an on‑call basis. These staff may include categories on the same basis as permanent ambulance operatives (with transport capability). |
Volunteer support staff | All personnel engaged on an unpaid casual basis that are not remunerated and are principally involved in the provision of support services. These can be people in operational support roles provided they do not receive payment for their services other than reimbursement of ‘out of pocket expenses’. |
References
Paramedics Australasia, 2020, https://paramedics.org/professional-standards (accessed 4 May 2020).
Paramedicine Board of Australia, 2018, Registration standards, https://www.paramedicineboard.gov.au/Registration.aspx (accessed 22 October 2019).
Download supporting material
- 11 Ambulance services data tables (XLSX - 164 Kb)
- 11 Ambulance services dataset (CSV - 250 Kb)
See the corresponding table number in the data tables for detailed definitions, caveats, footnotes and data source(s).