Closing the Gap Annual Data Compilation Report July 2022
Summary
The Annual Data Compilation Report provides a point-in-time snapshot of progress under the National Agreement on Closing the Gap (the Agreement). This is the second of the Annual Reports. It provides new information for the Priority Reform outcome areas on progress towards developing data to measure the targets and indicators. For the socioeconomic outcome areas, an additional year of data and disaggregations for the targets is provided, along with new reporting for the supporting indicators.
The Priority Reforms are the foundation of the Agreement, and commit all Australian governments and the Coalition of Aboriginal and Torres Strait Islander Peak Organisations (the Parties) to tangible and measurable actions. These actions are designed to change the way governments work with Aboriginal and Torres Strait Islander people, organisations and communities.
Directly monitoring the implementation of the Priority Reforms is designed to promote accountability for these actions. Therefore, getting the measurement right for the Priority Reforms is important and will take time. The measurement of the Priority Reforms is new so it is being developed largely from scratch, and at each phase the Parties need to have an agreed understanding on what is to be measured.
Work on developing measurement for the Priority Reforms is in its early phases. The Parties have developed and agreed an approach that aims to ensure that measurement is done in a consistent and coherent way across the Priority Reforms. Work to develop and agree on the measurement concepts and calculations is now underway.
The Agreement also identifies 17 socioeconomic outcomes important to the rights, wellbeing and quality of life of Aboriginal and Torres Strait Islander people. Monitoring these socioeconomic outcomes will help to determine if the Agreement is working to accelerate improvements in the lives of Aboriginal and Torres Strait Islander people. Additional information is now available on the targets both overall and for different population groups, along with some supporting indicators.
The socioeconomic targets provide limited information on progress at this stage. No new data are available since the baseline year for eight of the targets, and for the targets where there are new data available the most recent data are for 2021, only one year after the Agreement commenced.
For the targets that have new data and assessments of progress, the results are mixed and most need to be used with caution.
- Four are on track (healthy birthweight of babies, the enrolment of children in the preschool, youth detention rates and land mass subject to rights and interests).
- Five are not on track (children commencing school developmentally on track, out-of-home care, adult imprisonment, suicide deaths, and sea country subject to rights and interests).
These results also need to be understood in context. They are highly aggregated and may not reflect the outcomes for different population groups. While information on outcomes across different population groups is limited, some broad patterns emerge. Barriers to better outcomes appear to have a greater impact on Aboriginal and Torres Strait Islander people than non-Indigenous people in regional and remote areas. That is, Aboriginal and Torres Strait Islander people generally experience increasingly poor outcomes as remoteness increases whereas non-Indigenous people do not (or not to the same extent). Supporting indicators that are now available can also help provide a more complete story on the socioeconomic outcomes.
As with the Priority Reforms, getting the measurement right for the socioeconomic outcome areas is important to promote accountability. The priorities here are to ensure the assessments of progress for the targets are accurate and comprehensive, and to develop indicators using data that reflect Aboriginal and Torres Strait Islander people’s perspectives.
Priority Reform targets
|
Phases for developing measurement |
Partnership arrangements in place between Aboriginal and Torres Strait Islander people and governments enshrining joint decision-making |
Increase the amount of government funding going through Aboriginal and Torres Strait Islander community controlled organisations |
Decrease the proportion of Aboriginal and Torres Strait Islander people who experience racism |
Increase the number of regional data projects to support Aboriginal and Torres Strait Islander communities to make decisions |
|---|---|---|---|---|
|
Phase One: Develop and agree an approach for developing measurement |
complete | complete | complete | complete |
|
Phase Two: Develop and agree on the measurement concepts and computation |
in progress | in progress | in progress | in progress |
|
Phase Three: Develop data for reporting on the measures |
not started | not started | not started | not started |
|
Phase Four: Collect the data for reporting |
not started | not started | not started | not started |
|
Phase Five: Report data and build the timeseries |
not started | not started | not started | not started |
Socioeconomic targets*
Latest results at June 2022 and progress since the baseline year
 89.5% of babies were born with a healthy birthweight in 2019
96.7% of children were enrolled in preschool in 2021
 34.3% of children commencing school were developmentally on track in 2021
57.6 per
1000 children were in out-of-home care in 2021
23.2 per
10,000 young people were in detention in 2020-21
2222.7 per
100,000 adults in prison in 2021
27.9 per
100,000 people took their own life in 2020
4,027,232 km2
of land
 90,555 km2
of sea country
were subject to Aboriginal and Torres Strait Islander people’s rights or interests in 2021
Key
Good improvement and on track
Improvement but not on track
Worsening, not on track
* Results relating to the Aboriginal and Torres Strait Islander population and where new data are available since the previous Report
This is the second Annual Data Compilation Report (the Report) monitoring progress under the National Agreement on Closing the Gap (the Agreement).
This section outlines the important role of monitoring progress for accountability under the Agreement, the framework for monitoring progress and what information is available. The remaining two sections discuss the importance of getting it right when monitoring progress under the Agreement to promote accountability, and what information is currently available to monitor progress for implementing the Priority Reforms (section 2) and achieving the socioeconomic outcomes (section 3).
Accountability under the Agreement – what is the role of ‘monitoring of progress’?
The public implementation and accountability frameworks under the Agreement comprise a number of elements (figure 1.1). Together these elements commit the Parties — that is, Commonwealth, State and Territory governments, the Australian Local Government Association and the Coalition of Aboriginal and Torres Strait Islander Peak Organisations (Coalition of Peaks) − to implement and be accountable for the agreed actions and progress under the Agreement (sections 8 and 9 of the Agreement).
Figure 1.1 – Public implementation and accountability frameworks
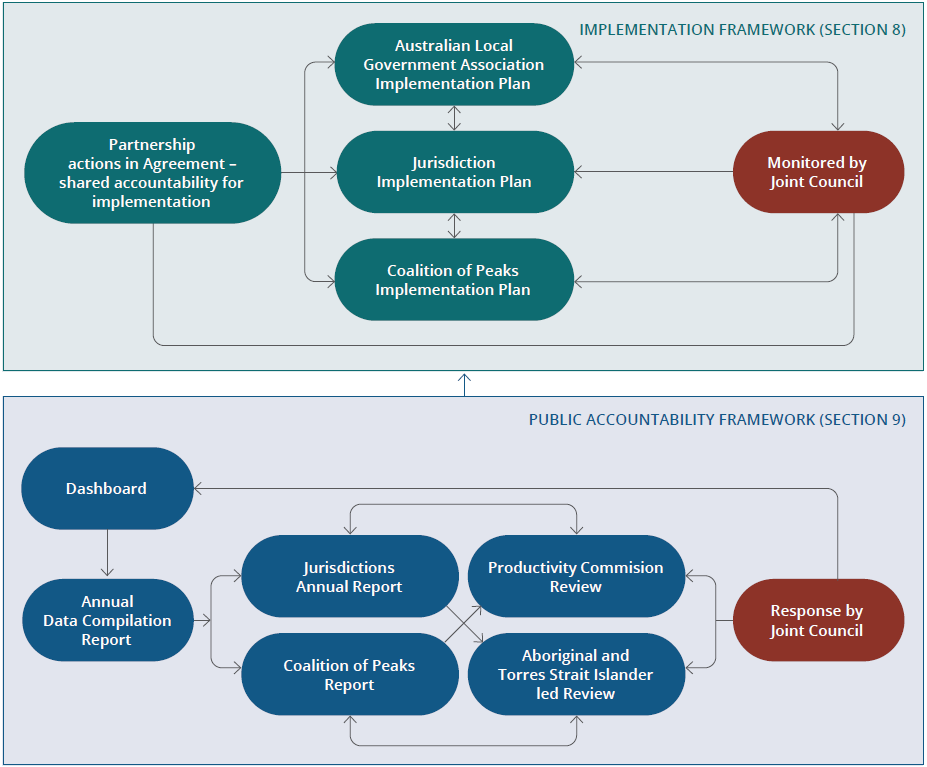
Key
Arrow shows the main direction of input across the elements.
A key element of the public accountability framework is the monitoring of progress toward achieving the agreed objective and the outcomes. Progress is monitored using data and information reported on the Closing the Gap Dashboard (the Dashboard) and in this Report.
The data and information used to monitor progress will also be key inputs to the other accountability elements. The other accountability elements include:
- annual reports prepared by each of the Parties to the Agreement setting out their progress under the Agreement and their Implementation Plans. These annual reports are to draw on information from the Dashboard and the Report to ensure consistency of measurement (clause 118a)
- two independent but complementary three-yearly reviews, one by the Productivity Commission and the other led by Aboriginal and Torres Strait Islander people. A key part of the Productivity Commission review will be to analyse progress on Closing the Gap (clause 121), which will draw on the data and information provided through the Dashboard and this Report along with other sources of information.
The data and information used to monitor progress will also inform and shape the implementation of the Agreement (figure 1.1). If progress toward an agreed outcome is not meeting expectations − that is, a target reported in this Report is not on track, or if one of the Productivity Commission’s three-yearly reviews indicates that achievement of an outcome is unlikely − actions to address this lack of progress are to be included in Jurisdictional Implementation Plans (clause 91).1
What is the framework for monitoring progress under the Agreement?
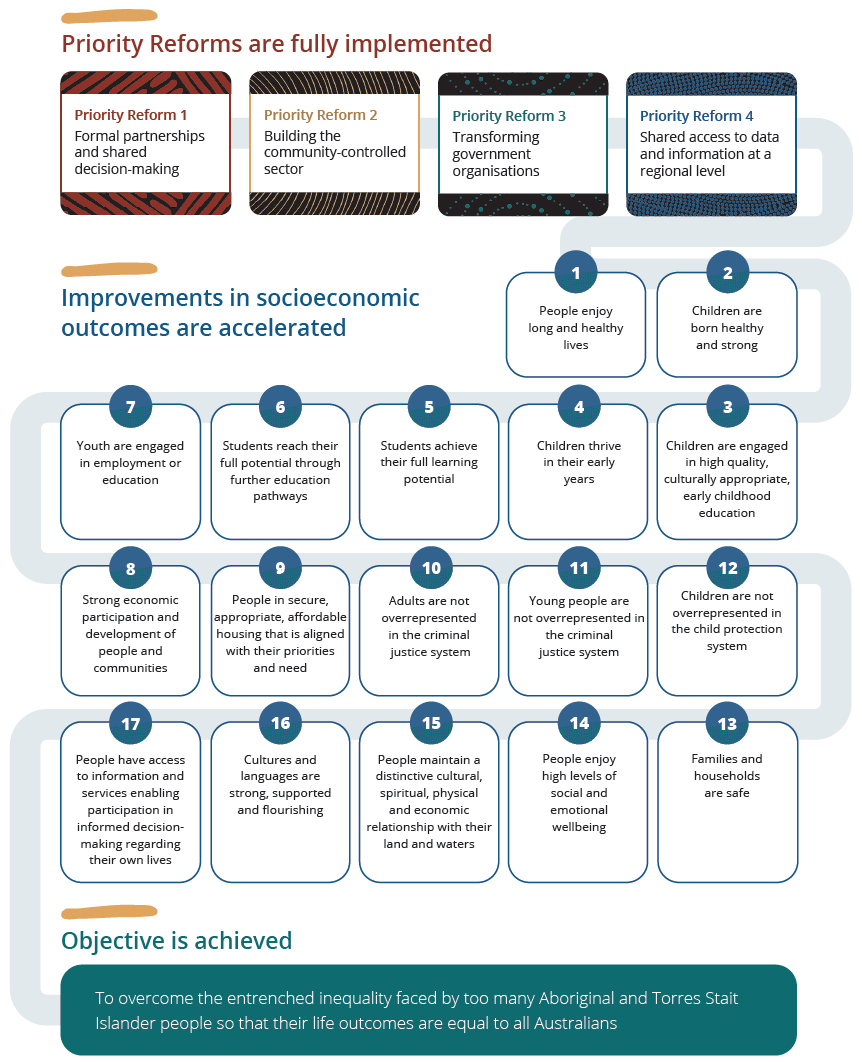
The framework for monitoring progress under the Agreement is based on the objective and outcomes. Under the Agreement, all the Parties have committed to ‘mobilising all avenues and opportunities available to them’ (clause 16) to achieve the following objective:
‘… to overcome the entrenched inequality faced by too many Aboriginal and Torres Strait Islander people so that their life outcomes are equal to all Australians’ (clause 15).
It is difficult to measure progress in achieving such a broadly stated objective, and to hold Parties to the Agreement accountable. Therefore, the Parties have also committed to specific outcomes against which progress can be measured (clause 17):
- Priority Reform outcomes — four outcomes related to reforming the way that government works to ‘accelerate improvements in the lives of Aboriginal and Torres Strait Islander people’ (clause 25)
- Socioeconomic outcomes — outcomes important to the rights, wellbeing and quality of life of Aboriginal and Torres Strait Islander people. Currently there are 17 socioeconomic outcomes identified across a range of life areas including health, education, employment, housing, safety, and strength in culture and language.
The framework for monitoring progress reflects the aim of the Agreement, that is, that the full implementation of the Priority Reforms will support an accelerated improvement in the socioeconomic outcomes (clause 25), so that the objective can be achieved (figure 1.2). This is why progress is to be monitored for outcomes related to the implementation of the Priority Reforms, along with the socioeconomic outcomes (which cover the important elements of the broader ‘life outcomes’ referred to in the Agreement). Monitoring the implementation of the Priority Reforms will show if the Parties have done what they committed to. Monitoring the socioeconomic outcomes will show if life outcomes for Aboriginal and Torres Strait Islander people are improving as a result.
Figure 1.2 – Logic of the framework for measuring progress
How is progress towards the outcomes being monitored?
Progress toward achieving the outcomes is being monitored through an agreed set of targets and indicators (figure 1.3). The targets are the key accountability measures for monitoring progress under the Agreement (clauses 81-82), but the Agreement also identifies supporting indicators that are to provide additional information on the drivers of the outcomes and further context. Furthermore, to monitor how well the objective and outcomes are being achieved across the whole of the Aboriginal and Torres Strait Islander population, the Agreement identifies different population groups including cohorts experiencing vulnerability for whom data are to be disaggregated. In some cases, important information to understand progress is not currently available, so the Agreement includes data development items (which relate to both additional indicators and disaggregations), with work to develop these items currently underway.2
| Outcome | Target | Indicator | Data development items |
|---|---|---|---|
| What are we trying to achieve? | Are we making progress towards the outcome? | What else do we need to measure to assess if we are making progress? | What else do we need to measure but currently cannot? |
What information for monitoring progress is now available?
The development of information for the Dashboard and this Report is being undertaken in stages. Since the last Report (July 2021), two Dashboard updates have been released (March and June 2022). This Report provides a snapshot of the results available as at 30 June 2022 (attachment A).
Work has begun to develop reporting for the Priority Reform outcome areas, but no data are yet available (see section 2 and attachment A).
For the socioeconomic outcome areas key data or information released since the last Report comprises:
- an additional year of data and new assessments of progress for eight socioeconomic targets – outcome areas 2, 3, 4, 10, 11, 12, 14 and 15
- new disaggregations of data for eight targets – for different population groups, including by age group, sex, disability status, remoteness areas and socioeconomic status of the location – outcome areas 1, 2, 3, 4, 10, 11, 12 and 14
- data for 14 supporting indicators – across outcome areas 1, 2, 3, 6, 7, 8, 9, 11, 12, 14, 15, 16 and 17 − with development work undertaken for one additional indicator in outcome area 13.
The Priority Reforms are the foundation of the Agreement, with the Parties agreeing they are the key to its success. That is, the Parties have agreed that full implementation of the Priority Reforms will accelerate improvements in the lives of Aboriginal and Torres Strait Islander people, so that their life outcomes are equal to other Australians (section 1).
The Priority Reforms commit the Parties to tangible actions. These actions are designed to change the way governments work with Aboriginal and Torres Strait Islander people, organisations and communities, and are also designed to support the prioritisation of Aboriginal and Torres Strait Islander cultures so that when implemented they promote rather than diminish these cultures (clauses 21-22 and 25). The Agreement includes jurisdictional and partnership actions (covering all Parties to the Agreement), and jurisdictions (Commonwealth, State and Territory governments) have committed to include ‘actions to achieve the Priority Reforms’ (clause 108d) in their Implementation Plans.
Why is it important to monitor the implementation of the Priority Reforms and to get this monitoring right?
The Agreement takes a different approach to the previous agreement (the National Indigenous Reform Agreement), where monitoring focussed solely on socioeconomic outcomes. Although monitoring the socioeconomic outcomes is important and will continue, direct monitoring of the Priority Reforms is a key part of the new approach in the Agreement.
Directly monitoring the implementation of the Priority Reforms should promote accountability on the Parties for their actions under the Agreement; in particular, accountability on governments. For each Priority Reform outcome area, progress is to be monitored through:
- targets that ‘focus on measuring the change governments are making in the way they work with Aboriginal and Torres Strait Islander people’ (clause 79.a and table 2.1)
- supporting indicators that provide ‘greater understanding of, and insight into, how all governments are tracking against the outcomes and targets’ (clause 81.b.iii).
To promote accountability through this monitoring, it is important to get it right with the measurement of the Priority Reform targets and supporting indicators.
|
Priority Reform areas |
Outcome |
Target |
|---|---|---|
|
Priority Reform 1 Formal partnerships and shared decision making |
Aboriginal and Torres Strait Islander people are empowered to share decision-making authority with governments to accelerate policy and place-based progress on Closing the Gap through formal partnership arrangements. [clause 17.a]. |
There will be formal partnership arrangements to support Closing the Gap in place between Aboriginal and Torres Strait Islander people and governments in place in each state and territory enshrining agreed joint decision-making roles and responsibilities and where Aboriginal and Torres Strait Islander people have chosen their own representatives [clause 81.a.i]. |
|
Priority Reform 2 Building the community-controlled sector |
There is a strong and sustainable Aboriginal and Torres Strait Islander community-controlled sector delivering high quality services to meet the needs of Aboriginal and Torres Strait Islander people across the country [clause 17.b]. |
Increase the amount of government funding for Aboriginal and Torres Strait Islander programs and services going through Aboriginal and Torres Strait Islander community-controlled organisations [clause 81.a.ii]. |
|
Priority Reform 3 Transforming government organisations |
Governments, their organisations and their institutions are accountable for Closing the Gap and are culturally safe and responsive to the needs of Aboriginal and Torres Strait Islander people, including through the services they fund [clause 17.c]. |
Decrease in the proportion of Aboriginal and Torres Strait Islander people who have experiences of racism [clause 81.a.iii]. |
|
Priority Reform 4 Shared access to data and information at a regional level |
Aboriginal and Torres Strait Islander people have access to, and the capability to use, locally relevant data and information to set and monitor the implementation of efforts to close the gap, their priorities and drive their own development [clause 17.d]. |
Increase the number of regional data projects to support Aboriginal and Torres Strait Islander communities to make decisions about Closing the Gap and their development [clause 81.a.iv]. |
What does it take to get measurement of the Priority Reforms right and what progress has been made?
Getting the measurement right for the Priority Reform targets and supporting indicators will take time. The measurement of the Priority Reforms is new so it is being developed largely from scratch, and at each phase the Parties need to agree on what is to be measured.
Work on developing measurement is underway but is in its early phases. Getting the measurement right in these early phases means the development is done in a consistent and coherent way across the Priority Reforms. This requires building a common understanding across the Parties about how the specified targets and indicators should be measured.
To guide the work, a tool has been agreed for use by the Parties. Development of this tool was phase one (now complete), with three subsequent phases (which include and implement the steps in the tool) to be completed before the final phase, which is the reporting of data on the Priority Reform targets and supporting indicators (box 2.1). This Report will continue to monitor development of measurement across these phases and include data on the targets and indicators as they become available.
Box 2.1 – Developing measurement of the Priority Reforms
Developing measurement of the Priority Reform targets and supporting indicators – five key phases
The approach for developing measurement of the Priority Reform targets and supporting indicators has five broad phases.
Phase One
Develop and agree an approach for developing measurement of the Priority Reform targets and supporting indicators.
Phase Two
Develop and agree on the measurement concepts and calculations: identify and define key concepts and describe how the measures will be calculated, that is how will they be put together (for example, numerator and denominator, and calculations).
Phase Three
Develop data for reporting on the measures: develop and agree counting rules that align with the agreed definitions for the concepts, and identify potential data sources either from an existing source or the mechanism to collect them.
Phase Four
Collect the data for reporting: collate and validate the data and document any concerns with the measurement of indicators (for example, is it a proxy for the indicator) or data quality issues.
Phase Five
Report the data and build a time series for reporting.
Work has also begun to develop and agree on ‘measurement concepts and calculations’ across the Priority Reforms (phase two). This requires considering how the targets and indicators can be measured so that they:
- show whether the outcome has been achieved — that is, what are the concepts to be measured and how does this relate to the outcome
- address a substantive element of the outcome
- enable improvements or worsening of the results to be linked back to actions of the Parties
- are based on clear definitions of key concepts, to which the Parties agree.
Using Priority Reform 3 as an example, some of the questions that might be answered as part of phase two include the following:
- Given the outcome identifies transforming governments, their organisations and institutions, should the target measure identify experiences of racism specifically when interacting with key government agencies and institutions (for example, across services such as police, child protection services and public hospitals)? Or, as the target does not specifically reference governments should it be interpreted more broadly to encompass racism experienced across the community?
- How are ‘experiences of racism’ to be defined – for example, should it be based on a person’s expectation of how they should be treated relative to how they were treated (that is, their view that they experienced/did not experience racism based on their perception of what racism is)? Or, should it be based on specific types of treatment experienced (that is direct and indirect actions that occurred, such as being physically or verbally abused due to race, or had to wait longer for a service than people of other races)?
Once the work of developing and agreeing ‘measurement concepts and calculations’ is completed, getting it right means developing, identifying and collating data that are fit for purpose (phase three). This would include for example, identifying data from sources where the perspectives of Aboriginal and Torres Strait Islander people are embedded, and considering if the data are of good quality (for example, if collected using a survey is the sample sufficient to provide a reliable estimate).
The socioeconomic outcomes focus on the life outcomes experienced by Aboriginal and Torres Strait Islander people. The life outcomes are in areas that Aboriginal and Torres Strait Islander people consider important for their wellbeing, including education, employment, health and wellbeing, interaction with the criminal justice system, access to land and waters, and the strength of Aboriginal and Torres Strait Islander cultures and languages.
Monitoring these socioeconomic outcomes will show if improvements in the lives of Aboriginal and Torres Strait Islander people are accelerating under the Agreement, so that their life outcomes become equal to other Australians (section 1). Information for understanding progress towards achieving these outcomes is now available on the targets both overall and for different population groups, along with some supporting indicators. Work to get the measurement right across the targets and indicators is ongoing, with the initial focus on improving the method for assessing progress and on developing reporting that better reflects the perspectives of Aboriginal and Torres Strait Islander people.
What can the latest results tell us?
Monitoring of the targets provides limited information on progress under the Agreement at this stage
The targets are the key mechanism for monitoring progress for the socioeconomic outcomes (section 1). A target provides a quantifiable measure of a life outcome for Aboriginal and Torres Strait Islander people to be experienced in a future period (as specified in the Agreement). The baseline year for the target represents the starting point for that life outcome from which progress is measured.
At this stage, the monitoring of the targets provides limited information on progress under the Agreement (signed in July 2020) toward achieving the socioeconomic outcomes. For eight of the targets under the 17 socioeconomic outcome areas, no new data are available since the baseline year. For targets where new data are available since the baseline year:
- three have a new year of data from before or around the commencement of the Agreement (targets for socioeconomic outcome areas 1, 2 and 14)
- six have new data available for monitoring progress up to 2021, but this is still only one year after the commencement of the Agreement (targets for socioeconomic outcome areas 3, 4, 10, 11, 12 and 15).
Over time as more years of data become available, monitoring of the targets will provide greater insight into what progress is being made under the Agreement. An indication of how long this may take is provided under the current method for the assessments of progress, which requires at least five data points (for annual data this would be to 2025) to provide an assessment with a high degree of confidence (with this confidence level also subject to the variability of the data itself).
For the targets that have new assessments of progress, the results are mixed and most assessments need to be used with caution
While information to assess progress under the Agreement is limited, for the nine targets with new information available (since the 2021 Report3) it is possible to assess progress since the baseline year. These assessments show if outcomes are worsening, there is no change, or they are improving, and if this improvement continues whether it is sufficient for the target (the desired outcome) to be met in future at the national level.
All but one of these nine assessments should be considered with caution. They are based on trends estimated using a very limited number of data points (less than five years of data for all but one target). With limited data points (or years of data) it is difficult to know if the estimated trend is a real one that is likely to continue into future years. For the one target where the assessment is based on five or more data points (target 3), an indication of confidence in this assessment is provided. Please see the How to interpret the data page (www.pc.gov.au/closing-the-gap-data/how-to/interpret-data) for more information.
The results are mixed. A summary of the national assessments for the latest results is provided below:
Summary of the National Assessments
Target 1
Life expectancy is a measure of whether Aboriginal and Torres Strait Islander people are enjoying long and healthy lives. It is reported separately for males and females and measured relative to non-Indigenous people as a ‘gap’ in years of life.
Nationally, Aboriginal and Torres Strait Islander males born in 2015–2017 are expected to live to 71.6 years and females to 75.6 years, which narrowed the gap in life expectancy from 2005-2007 for males (from 11.4 years to 8.6 years) and females (from 9.6 years to 7.8 years). While this represents an improvement, the national target of ‘no gap’ in life expectancy is not on track to be met for males or females – however, this assessment should be used with caution as it is based on a limited number of data points.
Target 2
Healthy birthweight is a measure of whether Aboriginal and Torres Strait Islander children are born healthy and strong. It is reported as the proportion of babies born with a healthy birthweight.
Nationally in 2019, 89.5 per cent of Aboriginal and Torres Strait Islander babies born were of a healthy birthweight, which is an increase from 88.8 per cent in 2017 (the baseline year). This is a good improvement with the national target of ‘91 per cent’ on track to be met – however, this assessment should be used with caution as it is based on a limited number of data points.
Target 3
Early childhood education enrolment rates is a measure of whether Aboriginal and Torres Strait Islander children are engaged in high quality, culturally appropriate early childhood education in their early years. It is reported as the proportion of Aboriginal and Torres Strait Islander children in the Year Before Full time Schooling (YBFS) age cohort who were enrolled in a preschool program.
Nationally in 2021, 96.7 per cent of Aboriginal and Torres Strait Islander children in the YBFS age cohort were enrolled in a preschool program, which is an increase from 76.7 per cent in 2016 (the baseline year). This is a good improvement with the national target of ‘95 per cent’ on track to be met − this assessment is provided with a high level of confidence.
Target 4
Children assessed as developmentally on track is a measure of whether Aboriginal and Torres Strait Islander children are thriving in their early years. It is reported as the proportion of children commencing school who were assessed as being developmentally on track in all five Australian Early Development Census (AEDC) domains.
Nationally in 2021, 34.3 per cent of Aboriginal and Torres Strait Islander children commencing school were assessed as being developmentally on track in all five AEDC domains, which is a decrease from 35.2 per cent in 2018 (the baseline year). This is a worsening in the result, with the national target of ‘55 per cent’ not on track to be met − however, this assessment should be used with caution as it is based on a limited number of data points.
Target 10
Rates of incarceration is a measure of whether Aboriginal and Torres Strait Islander adults are overrepresented in the criminal justice system. It is reported as the age-standardised rate of Aboriginal and Torres Strait Islander prisoners per 100 000 adult population.
Nationally at 30 June 2021, the age-standardised rate of Aboriginal and Torres Strait Islander prisoners was 2222.7 per 100 000 adult population, which is an increase from 2142.9 per 100 000 adult population in 2019 (the baseline year). This is a worsening, with the national target of a ‘reduction of at least 15 per cent in the incarceration rate’ not on track to be met − however, this assessment should be used with caution as it is based on a limited number of data points.
Target 11
Rates of youth detention is a measure of whether Aboriginal and Torres Strait Islander young people are overrepresented in the criminal justice system. It is reported as the rate of Aboriginal and Torres Strait Islander young people aged 10–17 years in detention.
Nationally in 2020-21, the rate of Aboriginal and Torres Strait Islander young people aged 10–17 years in detention on an average day was 23.2 per 10 000 young people in the population, which is a decrease from 31.9 per 10 000 young people in 2018-19 (the baseline year). This is a good improvement with the national target of a ‘decrease of at least 30 per cent in the detention rate’ on track to be met − however, this assessment should be used with caution as it is based on a limited number of data points.
Target 12
Rates of children in out-of-home care is a measure of whether Aboriginal and Torres Strait Islander children are overrepresented in the child protection system. It is reported as the rate of Aboriginal and Torres Strait Islander children aged 0–17 years in out-of-home care.
Nationally in 2021, the rate of Aboriginal and Torres Strait Islander children aged 0–17 years in out-of-home care was 57.6 per 1000 children in the population, which is an increase from 54.2 per 1000 children in 2019 (the baseline year). This is a worsening in the result, with the national target of a ‘reduction in the rate of out-of-home care by 45 per cent’ not on track to be met − however, this assessment should be used with caution as it is based on a limited number of data points.
Target 14
Rates of suicide is a measure of whether Aboriginal and Torres Strait Islander people have high levels of social and emotional wellbeing. It is reported as the age-standardised suicide rate for Aboriginal and Torres Strait Islander people per 100 000 people.
In 2020, the suicide rate (for NSW, Queensland, WA, SA and the NT combined) for Aboriginal and Torres Strait Islander people was 27.9 per 100 000 people, which is an increase from 25.0 per 100 000 people in 2018 (the baseline year). This is a worsening, with the national target of a ‘significant and sustained reduction in suicide towards zero’ not on track to be met4 − however, this assessment should be used with caution as it is based on a limited number of data points.
Target 15
Land mass subject to, or sea covered by, Aboriginal and Torres Strait Islander people’s legal rights or interests is a measure of whether Aboriginal and Torres Strait Islander people maintain a distinctive cultural, spiritual, physical and economic relationship with their land and waters. It is reported as square kilometres of the land mass or sea country subject to Aboriginal and Torres Strait Islander people’s rights or interests.
Nationally in 2021, 4 027 232 square kilometres of the land mass and 90 555 square kilometres of the sea country were subject to Aboriginal and Torres Strait Islander people’s rights or interests, which is an increase from 3 911 679 square kilometres of the land mass and 90 252 square kilometres of the sea country in 2020 (the baseline year). This is good improvement for land mass with the national target of a ‘15 per cent’ increase in land mass subject to Aboriginal and Torres Strait Islander people’s rights or interests on track to be met, and while it is an improvement for sea country, this improvement is not enough for the national target of a ‘15 per cent’ increase in sea country subject to Aboriginal and Torres Strait Islander people’s rights or interests to be met. However, these assessments should be used with caution as they are based on a limited number of data points.
State and territory assessments of progress for these nine targets are also available (attachment A). Care should be taken in interpreting these assessments. They are not comparable to the national results as the State and Territory assessments are not tracked against an agreed target trajectory. Furthermore, different starting points (that is, baseline levels) across jurisdictions may influence the apparent nature and extent of progress. For example, a jurisdiction starting from a relatively poor baseline position (e.g. lower proportion of babies born with a healthy birthweight or higher rates of imprisonment relative to other jurisdictions) may see greater gains in the early years but could still be behind the national average at a point-in-time.
These aggregated results should also be considered alongside the results for different population groups
The assessments of progress for these nine targets are highly aggregated, and may not reflect the outcomes for different groups of Aboriginal and Torres Strait Islander people. Outcomes can vary as some groups experience additional barriers, including their location (for example, through reduced availability of key services and infrastructure) or personal circumstances (for example, through reduced mobility related to disability). Furthermore, some personal characteristics while not necessarily creating barriers, can influence outcomes for some targets, for example age and gender. To understand how the outcomes vary across different groups, disaggregations of the targets are now reported, including by remoteness areas, gender, and disability status.
While information on outcomes across different population groups (that is, disaggregations of the targets) is somewhat limited at this stage, some broad patterns emerge from the available data. One clear emerging pattern is that barriers to better outcomes appear to have a greater impact on Aboriginal and Torres Strait Islander people than non-Indigenous people in regional and remote areas. That is, Aboriginal and Torres Strait Islander people typically experience increasingly poor outcomes as remoteness increases, which is not the case for non-Indigenous people with the exception of suicide rates (see figure 3.1).
Figure 3.1 – Outcomes across remoteness areas for the socioeconomic targets
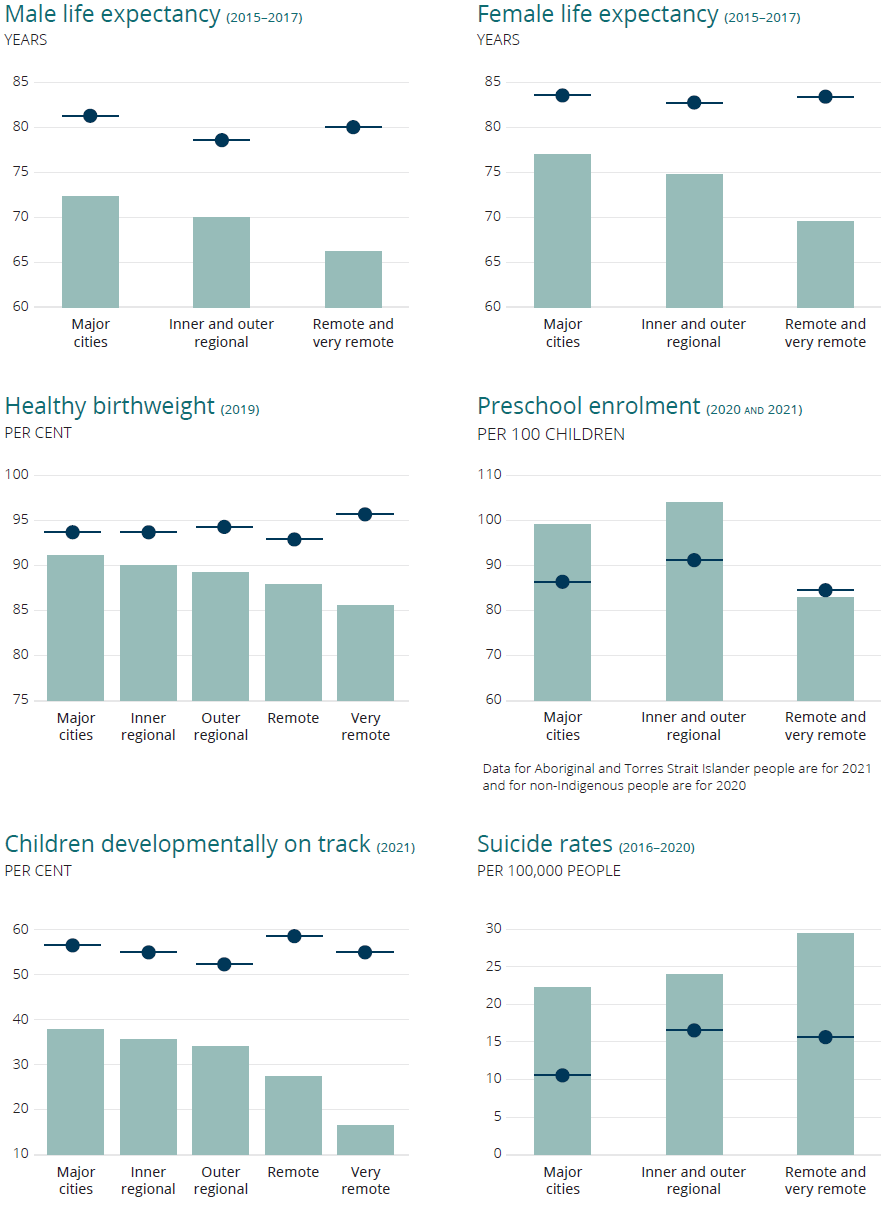
Key

Aboriginal and Torres Strait Islander people

Non-Indigenous people
Living in the most disadvantaged socioeconomic areas and being male also appear to impact negatively on some outcomes, a pattern that is experienced by both Aboriginal and Torres Strait Islander people and non-Indigenous people.
Some of the key data gaps or limitations for reporting on the different population groups include:
- across all targets for people with disability – data are not reported for some key targets (for example, for adult and young prisoners) and the information that is reported for most targets needs to be improved or developed (for example, for rates of children with disability in out-of-home care, the identification of disability in the administrative data set needs to improve and a comparable population estimate for children with disability needs to be developed)
- for adult and youth imprisonment rates – data sets with information on geographic location where prisoners resided before entering prison need to be developed, so outcomes can be understood for those from different geographic or socioeconomic status areas.
Results for supporting indicators are now available and help to provide a more complete story
Supporting indicators are also now available across the socioeconomic outcome areas. Development of the supporting indicators is to be done in stages, and work has begun on 15 of these indicators, although data are only available for 14 for this Report. These supporting indicators provide information on the drivers of the outcomes and other contextual factors. And, along with the target disaggregations, can support the overall target results to provide a more complete story on progress toward the socioeconomic outcomes.
Some socioeconomic outcome areas now have new data for all three types of reporting: that is, the overall target, disaggregations of the target and supporting indicators. One such area is ‘young people are not overrepresented in the criminal justice system’ and provides an example of how these elements of reporting can be pieced together to illustrate the performance story (box 3.1).
Box 3.1 – What the latest results can tell us about the socioeconomic outcome areas
Case study of outcome 11 ‘young people are not overrepresented in the criminal justice system’
Imprisonment rates for Aboriginal and Torres Strait Islander young people (aged 10−17 years) are decreasing, and if this trend continues they are on track to fall more than 30 per cent by 2031. Overrepresentation is also decreasing, and while it is close to 18 times the rate for non-Indigenous young people it is has decreased from 26 times in 2015-16 (table CtG11A.1).
Imprisonment rates for Aboriginal and Torres Strait Islander young males are higher than for young females (around 8 times), but rates have decreased for both since 2018-19. The rate for females decreased by 35 per cent from 2018-19 to 2020-21 (7.8 to 5.1 per 10 000 young females) with the rate for males falling by 26 per cent over the same period (55.0 to 40.5 per 10 000 young males) (table CtG11A.2).
System and structural factors can contribute to Aboriginal or Torres Strait Islander young people’s overrepresentation in prison, including:
-
the minimum age of criminal responsibility (MACR) − currently the age at which a child is deemed capable of having committed a criminal offence is 10 years or over, with this policy more likely to affect Aboriginal or Torres Strait Islander young people.
- In 2020-21, around three-quarters of young people aged 10-13 years in prison were Aboriginal and Torres Strait Islander children (28 of the 38 children), compared to around half of those aged 14 years or over (308 of 602 children) (table CtG11A.4).
- If the MACR was raised to 14 years old, the number of Aboriginal or Torres Strait Islander young people in prison would decrease by around 8 per cent (compared to 3 per cent for non-Indigenous young people) (table CtG11A.4), which would go some way to reducing, but not eradicating, the overrepresentation of Aboriginal or Torres Strait Islander young people in detention.
-
the way young people are dealt with by police – for those states and territories reporting data (five of eight jurisdictions), three saw a decrease in the rate at which Aboriginal and Torres Strait Islander young people were proceeded against by police since 2018-19 (table SE11c.1). However, in 2020-21 Aboriginal and Torres Strait Islander young people were still more likely than non-Indigenous young people:
- to have been proceeded against by police (from three to 17 times more likely across the five jurisdictions reported), and proceeded against more than once (tables SE11c1-2)
- to be proceeded against with court rather than non-court action (table SE11c.4), noting that these data are only available for three jurisdictions.
Gaps to be addressed to improve current reporting include the provision of data on young people and children in detention with disability, and where young people lived before entering detention, and addressing the data quality issues for proceedings by police against young people to enable reporting for all jurisdictions.
What is being done to get measurement of the socioeconomic outcomes right?
As with the Priority Reforms, to promote accountability through monitoring it is important to get it right with the measurement of the targets and supporting indicators for the socioeconomic outcome areas. The key accountability mechanism to assess progress toward an agreed outcome is if a target is ‘on track’, and if it is assessed as ‘not on track’ actions to address this lack of progress are to be included in Jurisdictional Implementation Plans (clause 91). Given this, the measurement of progress towards meeting the target needs to be done well. Furthermore, accountability will also be promoted by ensuring that the perspectives of Aboriginal and Torres Strait Islander people on the outcomes is provided through data accessed for the supporting indicators.
With this in mind, there are two important areas that will be the initial focus for getting measurement right for the socioeconomic outcome areas:
- ensuring the assessments of progress for the targets are accurate and comprehensive – that is, they use robust and fit-for-purpose statistical methods and can assess if the contribution of each state and territory toward achieving the national target is adequate. The current method, while improved from the initial one used for the first release of the Dashboard, is still subject to review and ongoing improvements and currently does not assess the relative contribution of each state and territory in meeting the national target.
- developing indicators using data that better capture Aboriginal and Torres Strait Islander people’s perspectives – that is, investigating what community controlled data sets are available that could replace, supplement and/or enhance existing datasets that are predominately government controlled.
Footnotes
- Jurisdictional in this context refers to Commonwealth, State and Territory governments. Locate Footnote 1 above
- A Data Development Plan is anticipated to be provided to the Joint Council in July 2022. Details of the Plan are provided in clauses 92-95 of the Agreement. Locate Footnote 2 above
- While there are nine targets with new information available since the baseline year, there is no new year of data since the 2021 Report for life expectancy (target 1). The new information for life expectancy relates to new data on disaggregations. A visual summary of the eight targets with a new year of data are provided in the summary section of this Report. Locate Footnote 3 above
- This target has four possible trajectories based on a 20 per cent, 25 per cent, 50 per cent, and 75 per cent reduction in the suicide rate. The assessment is based on a 75 per cent reduction, as the most ambitious of the target trajectories. Locate Footnote 4 above
Attachment A
Dashboard snapshots and data for download
The Productivity Commission acknowledges the Traditional Owners of Country throughout Australia and their continuing connection to land, waters and community. We pay our respects to their Cultures, Country and Elders past and present.
The Productivity Commission
The Productivity Commission is the Australian Government’s independent research and advisory body on a range of economic, social and environmental issues affecting the welfare of Australians. Its role, expressed most simply, is to help governments make better policies, in the long term interest of the Australian community.
The Commission’s independence is underpinned by an Act of Parliament. Its processes and outputs are open to public scrutiny and are driven by concern for the wellbeing of the community as a whole.
Further information on the Productivity Commission can be obtained from the Commission’s website (www.pc.gov.au).
© Commonwealth of Australia 2022
With the exception of the Commonwealth Coat of Arms and content supplied by third parties, this copyright work is licensed under a Creative Commons Attribution 4.0 International licence. In essence, you are free to copy, communicate and adapt the work, as long as you attribute the work to the Productivity Commission (but not in any way that suggests the Commission endorses you or your use) and abide by the other licence terms. The licence can be viewed at: https://creativecommons.org/licenses/by/4.0.
The terms under which the Coat of Arms can be used are detailed at: www.pmc.gov.au/government/commonwealth-coat-arms.
Wherever a third party holds copyright in this material, the copyright remains with that party. Their permission may be required to use the material, please contact them directly.
ISBN 978-1-74037-744-7 (online)
ISBN 978-1-74037-743-0 (PDF)
Attribution
This work should be attributed as follows, Source: Productivity Commission, Closing the Gap Annual Data Compilation Report July 2022.
If you have adapted, modified or transformed this work in anyway, please use the following, Source: based on Productivity Commission data, Closing the Gap Annual Data Compilation Report July 2022.
Publication enquiries
Strategic Communications and Engagement | phone: (03) 9653 2244 | email: publications@pc.gov.au